

STATISTICS â UNDERSTANDING HYPOTHESIS TESTS
STATISTICS â UNDERSTANDING HYPOTHESIS TESTS
STATISTICS â UNDERSTANDING HYPOTHESIS TESTS

Create successful ePaper yourself
Turn your PDF publications into a flip-book with our unique Google optimized e-Paper software.
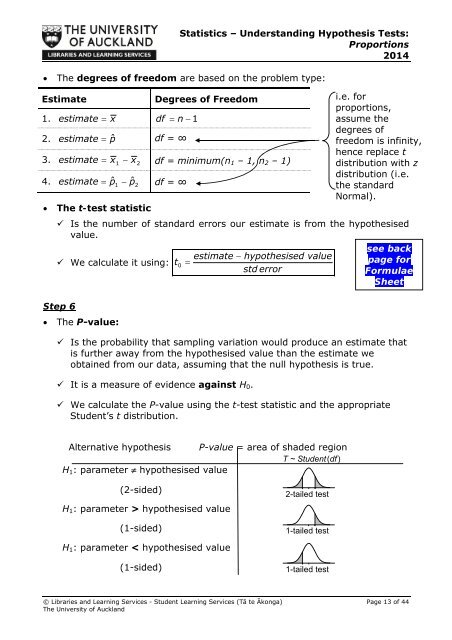
Statistics – Understanding Hypothesis Tests:Proportions2014The degrees of freedom are based on the problem type:EstimateDegrees of Freedomi.e. forproportions,1. estimate x df n 1assume thedegrees of2. estimate pˆdf = ∞freedom is infinity,hence replace t3. estimate x 1 x2df = minimum(n 1 – 1, n 2 – 1) distribution with zdistribution (i.e.4. estimate pˆˆ1 p2df = ∞the standardNormal). The t-test statistic Is the number of standard errors our estimate is from the hypothesisedvalue. We calculate it using:Step 6 The P-value:t0estimate hypothesised valuestd error Is the probability that sampling variation would produce an estimate thatis further away from the hypothesised value than the estimate weobtained from our data, assuming that the null hypothesis is true. It is a measure of evidence against H 0 .see backpage forFormulaeSheet We calculate the P-value using the t-test statistic and the appropriateStudent’s t distribution.Alternative hypothesis P-value = area of shaded regionT ~ Student(df )H 1 : parameter hypothesised value(2-sided)H 1 : parameter > hypothesised value(1-sided)2-tailed test1-tailed testH 1 : parameter < hypothesised value(1-sided)1-tailed test© Libraries and Learning Services - Student Learning Services (Tā te Ākonga) Page 13 of 44The University of Auckland


