STATISTICS â UNDERSTANDING HYPOTHESIS TESTS
STATISTICS â UNDERSTANDING HYPOTHESIS TESTS
STATISTICS â UNDERSTANDING HYPOTHESIS TESTS
You also want an ePaper? Increase the reach of your titles
YUMPU automatically turns print PDFs into web optimized ePapers that Google loves.
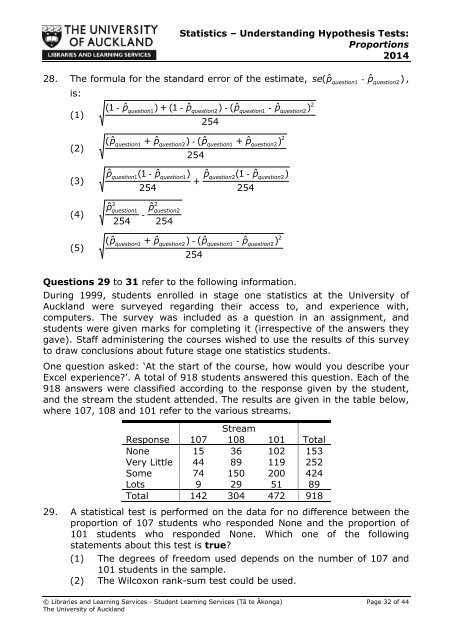
Statistics – Understanding Hypothesis Tests:Proportions201428. The formula for the standard error of the estimate, se( pˆquestionˆ1- pquestion2),is:2(1 - pˆ) + (1 ˆ ) (ˆ ˆquestion1 - pquestion2- pquestion1- pquestion2)(1)254(2)(3)(4)(5)(ˆ p + pˆ) - (ˆ p+ pˆquestion1 question2question1question2254pˆ ˆ ˆ (1 ˆquestion1(1- pquestion1)pquestion2- pquestion2)+25425422pˆquestionpˆ-254 2541 question2(ˆ p + pˆ) - (ˆ p - pˆquestion1 question2question1question2254))22Questions 29 to 31 refer to the following information.During 1999, students enrolled in stage one statistics at the University ofAuckland were surveyed regarding their access to, and experience with,computers. The survey was included as a question in an assignment, andstudents were given marks for completing it (irrespective of the answers theygave). Staff administering the courses wished to use the results of this surveyto draw conclusions about future stage one statistics students.One question asked: ‘At the start of the course, how would you describe yourExcel experience?’. A total of 918 students answered this question. Each of the918 answers were classified according to the response given by the student,and the stream the student attended. The results are given in the table below,where 107, 108 and 101 refer to the various streams.StreamResponse 107 108 101 TotalNone 15 36 102 153Very Little 44 89 119 252Some 74 150 200 424Lots 9 29 51 89Total 142 304 472 91829. A statistical test is performed on the data for no difference between theproportion of 107 students who responded None and the proportion of101 students who responded None. Which one of the followingstatements about this test is true?(1) The degrees of freedom used depends on the number of 107 and101 students in the sample.(2) The Wilcoxon rank-sum test could be used.© Libraries and Learning Services - Student Learning Services (Tā te Ākonga) Page 32 of 44The University of Auckland


