

STATISTICS â UNDERSTANDING HYPOTHESIS TESTS
STATISTICS â UNDERSTANDING HYPOTHESIS TESTS
STATISTICS â UNDERSTANDING HYPOTHESIS TESTS

Create successful ePaper yourself
Turn your PDF publications into a flip-book with our unique Google optimized e-Paper software.
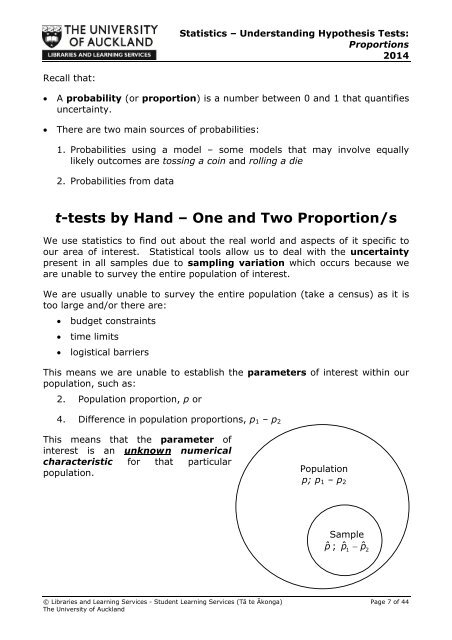
Statistics – Understanding Hypothesis Tests:Proportions2014Recall that:A probability (or proportion) is a number between 0 and 1 that quantifiesuncertainty.There are two main sources of probabilities:1. Probabilities using a model – some models that may involve equallylikely outcomes are tossing a coin and rolling a die2. Probabilities from datat-tests by Hand – One and Two Proportion/sWe use statistics to find out about the real world and aspects of it specific toour area of interest. Statistical tools allow us to deal with the uncertaintypresent in all samples due to sampling variation which occurs because weare unable to survey the entire population of interest.We are usually unable to survey the entire population (take a census) as it istoo large and/or there are: budget constraints time limits logistical barriersThis means we are unable to establish the parameters of interest within ourpopulation, such as:2. Population proportion, p or4. Difference in population proportions, p 1 – p 2This means that the parameter ofinterest is an unknown numericalcharacteristic for that particularpopulation.Populationp; p 1 – p 2Samplepˆ ; pˆˆ1 p2© Libraries and Learning Services - Student Learning Services (Tā te Ākonga) Page 7 of 44The University of Auckland


