

STATISTICS â UNDERSTANDING HYPOTHESIS TESTS
STATISTICS â UNDERSTANDING HYPOTHESIS TESTS
STATISTICS â UNDERSTANDING HYPOTHESIS TESTS

You also want an ePaper? Increase the reach of your titles
YUMPU automatically turns print PDFs into web optimized ePapers that Google loves.
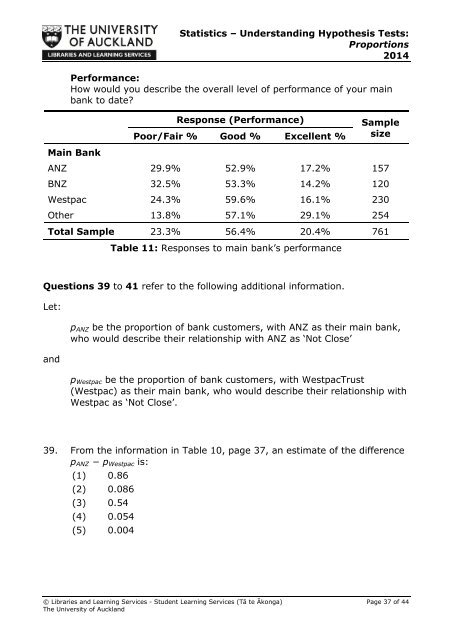
Statistics – Understanding Hypothesis Tests:Proportions2014Performance:How would you describe the overall level of performance of your mainbank to date?Response (Performance)Poor/Fair % Good % Excellent %SamplesizeMain BankANZ 29.9% 52.9% 17.2% 157BNZ 32.5% 53.3% 14.2% 120Westpac 24.3% 59.6% 16.1% 230Other 13.8% 57.1% 29.1% 254Total Sample 23.3% 56.4% 20.4% 761Table 11: Responses to main bank’s performanceQuestions 39 to 41 refer to the following additional information.Let:andp ANZ be the proportion of bank customers, with ANZ as their main bank,who would describe their relationship with ANZ as ‘Not Close’p Westpac be the proportion of bank customers, with WestpacTrust(Westpac) as their main bank, who would describe their relationship withWestpac as ‘Not Close’.39. From the information in Table 10, page 37, an estimate of the differencep ANZ − p Westpac is:(1) 0.86(2) 0.086(3) 0.54(4) 0.054(5) 0.004© Libraries and Learning Services - Student Learning Services (Tā te Ākonga) Page 37 of 44The University of Auckland


