

STATISTICS â UNDERSTANDING HYPOTHESIS TESTS
STATISTICS â UNDERSTANDING HYPOTHESIS TESTS
STATISTICS â UNDERSTANDING HYPOTHESIS TESTS

You also want an ePaper? Increase the reach of your titles
YUMPU automatically turns print PDFs into web optimized ePapers that Google loves.
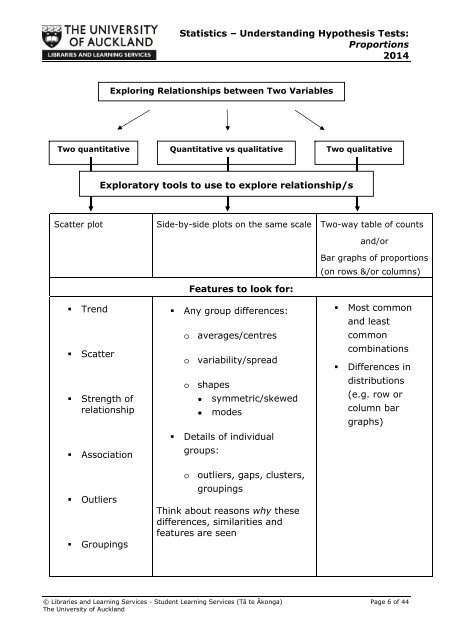
Statistics – Understanding Hypothesis Tests:Proportions2014Exploring Relationships between Two VariablesTwo quantitativeQuantitative vs qualitativeTwo qualitativeExploratory tools to use to explore relationship/sScatter plotSide-by-side plots on the same scale Two-way table of countsand/orBar graphs of proportions(on rows &/or columns)• Trend• Scatter• Strength ofrelationship• Association• Outliers• GroupingsFeatures to look for:• Any group differences:o averages/centreso variability/spreado shapes● symmetric/skewed● modes• Details of individualgroups:o outliers, gaps, clusters,groupingsThink about reasons why thesedifferences, similarities andfeatures are seen• Most commonand leastcommoncombinations• Differences indistributions(e.g. row orcolumn bargraphs)© Libraries and Learning Services - Student Learning Services (Tā te Ākonga) Page 6 of 44The University of Auckland


