STATISTICS â UNDERSTANDING HYPOTHESIS TESTS
STATISTICS â UNDERSTANDING HYPOTHESIS TESTS
STATISTICS â UNDERSTANDING HYPOTHESIS TESTS
Create successful ePaper yourself
Turn your PDF publications into a flip-book with our unique Google optimized e-Paper software.
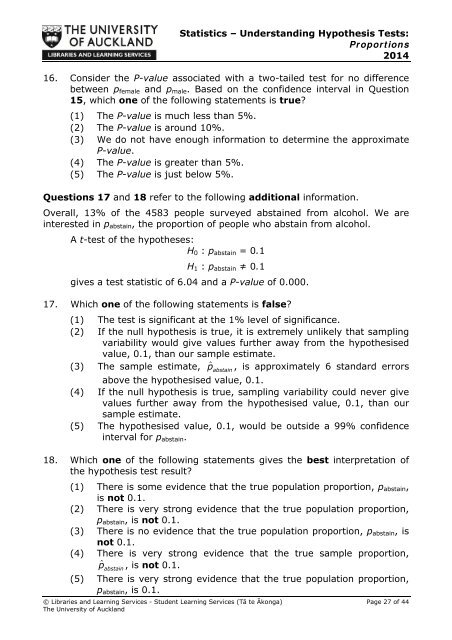
Statistics – Understanding Hypothesis Tests:Proportions201416. Consider the P-value associated with a two-tailed test for no differencebetween p female and p male . Based on the confidence interval in Question15, which one of the following statements is true?(1) The P-value is much less than 5%.(2) The P-value is around 10%.(3) We do not have enough information to determine the approximateP-value.(4) The P-value is greater than 5%.(5) The P-value is just below 5%.Questions 17 and 18 refer to the following additional information.Overall, 13% of the 4583 people surveyed abstained from alcohol. We areinterested in p abstain , the proportion of people who abstain from alcohol.A t-test of the hypotheses:H 0 : p abstain = 0.1H 1 : p abstain ≠ 0.1gives a test statistic of 6.04 and a P-value of 0.000.17. Which one of the following statements is false?(1) The test is significant at the 1% level of significance.(2) If the null hypothesis is true, it is extremely unlikely that samplingvariability would give values further away from the hypothesisedvalue, 0.1, than our sample estimate.(3) The sample estimate, pˆ abstain, is approximately 6 standard errorsabove the hypothesised value, 0.1.(4) If the null hypothesis is true, sampling variability could never givevalues further away from the hypothesised value, 0.1, than oursample estimate.(5) The hypothesised value, 0.1, would be outside a 99% confidenceinterval for p abstain .18. Which one of the following statements gives the best interpretation ofthe hypothesis test result?(1) There is some evidence that the true population proportion, p abstain ,is not 0.1.(2) There is very strong evidence that the true population proportion,p abstain , is not 0.1.(3) There is no evidence that the true population proportion, p abstain , isnot 0.1.(4) There is very strong evidence that the true sample proportion,pˆabstain, is not 0.1.(5) There is very strong evidence that the true population proportion,p abstain , is 0.1.© Libraries and Learning Services - Student Learning Services (Tā te Ākonga) Page 27 of 44The University of Auckland


