

STATISTICS â UNDERSTANDING HYPOTHESIS TESTS
STATISTICS â UNDERSTANDING HYPOTHESIS TESTS
STATISTICS â UNDERSTANDING HYPOTHESIS TESTS

You also want an ePaper? Increase the reach of your titles
YUMPU automatically turns print PDFs into web optimized ePapers that Google loves.
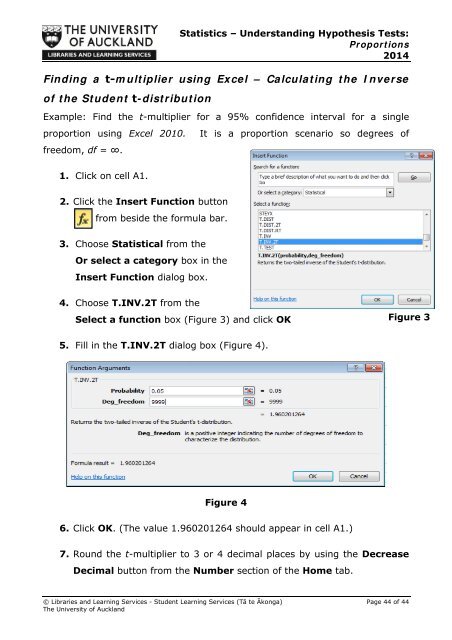
Statistics – Understanding Hypothesis Tests:Proportions2014Finding a t-multiplier using Excel – Calculating the Inverseof the Student t-distributionExample: Find the t-multiplier for a 95% confidence interval for a singleproportion using Excel 2010.freedom, df = ∞.It is a proportion scenario so degrees of1. Click on cell A1.2. Click the Insert Function buttonfrom beside the formula bar.3. Choose Statistical from theOr select a category box in theInsert Function dialog box.4. Choose T.INV.2T from theSelect a function box (Figure 3) and click OKFigure 35. Fill in the T.INV.2T dialog box (Figure 4).Figure 46. Click OK. (The value 1.960201264 should appear in cell A1.)7. Round the t-multiplier to 3 or 4 decimal places by using the DecreaseDecimal button from the Number section of the Home tab.© Libraries and Learning Services - Student Learning Services (Tā te Ākonga) Page 44 of 44The University of Auckland


