STATISTICS â UNDERSTANDING HYPOTHESIS TESTS
STATISTICS â UNDERSTANDING HYPOTHESIS TESTS
STATISTICS â UNDERSTANDING HYPOTHESIS TESTS
You also want an ePaper? Increase the reach of your titles
YUMPU automatically turns print PDFs into web optimized ePapers that Google loves.
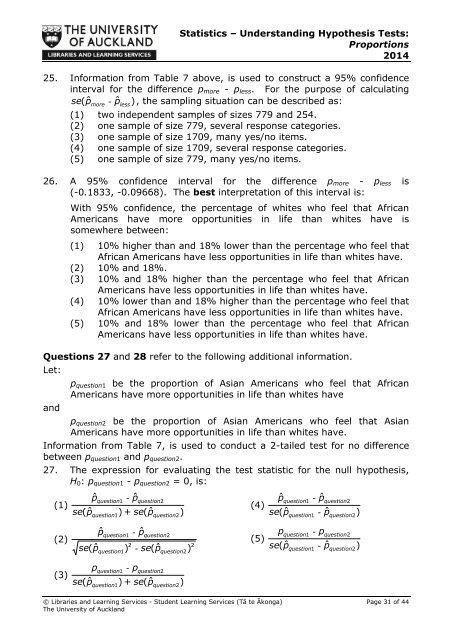
Statistics – Understanding Hypothesis Tests:Proportions201425. Information from Table 7 above, is used to construct a 95% confidenceinterval for the difference p more - p less . For the purpose of calculatingse( pˆmore- pˆless), the sampling situation can be described as:(1) two independent samples of sizes 779 and 254.(2) one sample of size 779, several response categories.(3) one sample of size 1709, many yes/no items.(4) one sample of size 1709, several response categories.(5) one sample of size 779, many yes/no items.26. A 95% confidence interval for the difference p more - p less is(-0.1833, -0.09668). The best interpretation of this interval is:With 95% confidence, the percentage of whites who feel that AfricanAmericans have more opportunities in life than whites have issomewhere between:(1) 10% higher than and 18% lower than the percentage who feel thatAfrican Americans have less opportunities in life than whites have.(2) 10% and 18%.(3) 10% and 18% higher than the percentage who feel that AfricanAmericans have less opportunities in life than whites have.(4) 10% lower than and 18% higher than the percentage who feel thatAfrican Americans have less opportunities in life than whites have.(5) 10% and 18% lower than the percentage who feel that AfricanAmericans have less opportunities in life than whites have.Questions 27 and 28 refer to the following additional information.Let:p question1 be the proportion of Asian Americans who feel that AfricanAmericans have more opportunities in life than whites haveandp question2 be the proportion of Asian Americans who feel that AsianAmericans have more opportunities in life than whites have.Information from Table 7, is used to conduct a 2-tailed test for no differencebetween p question1 and p question2 .27. The expression for evaluating the test statistic for the null hypothesis,H 0 : p question1 - p question2 = 0, is:(1)se(ˆppˆ- pˆquestion1question1question2) + se(ˆpquestion2)(4)pˆse(ˆpquestion1question1- pˆquestion2- pˆquestion2)(2)se(ˆppˆquestion1question1)2- pˆquestion2- se(ˆpquestion2)2(5)sep- pquestion1question2( pˆˆquestion1- pquestion2)(3)se pˆp - pquestion1question2(question1question2) + se(ˆp)© Libraries and Learning Services - Student Learning Services (Tā te Ākonga) Page 31 of 44The University of Auckland


