

STATISTICS â UNDERSTANDING HYPOTHESIS TESTS
STATISTICS â UNDERSTANDING HYPOTHESIS TESTS
STATISTICS â UNDERSTANDING HYPOTHESIS TESTS

Create successful ePaper yourself
Turn your PDF publications into a flip-book with our unique Google optimized e-Paper software.
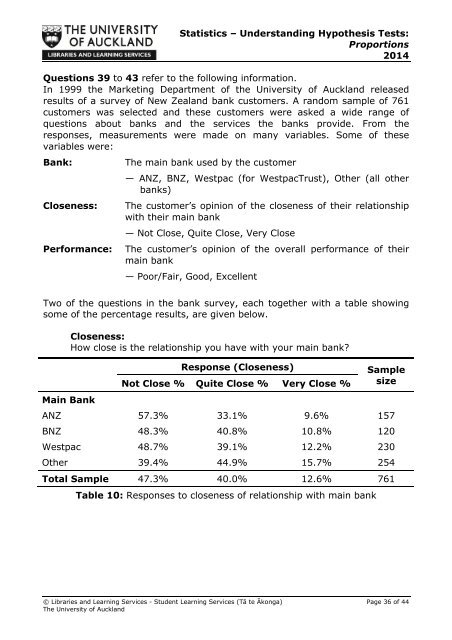
Statistics – Understanding Hypothesis Tests:Proportions2014Questions 39 to 43 refer to the following information.In 1999 the Marketing Department of the University of Auckland releasedresults of a survey of New Zealand bank customers. A random sample of 761customers was selected and these customers were asked a wide range ofquestions about banks and the services the banks provide. From theresponses, measurements were made on many variables. Some of thesevariables were:Bank:Closeness:Performance:The main bank used by the customer— ANZ, BNZ, Westpac (for WestpacTrust), Other (all otherbanks)The customer’s opinion of the closeness of their relationshipwith their main bank— Not Close, Quite Close, Very CloseThe customer’s opinion of the overall performance of theirmain bank— Poor/Fair, Good, ExcellentTwo of the questions in the bank survey, each together with a table showingsome of the percentage results, are given below.Main BankCloseness:How close is the relationship you have with your main bank?Response (Closeness)Not Close % Quite Close % Very Close %SamplesizeANZ 57.3% 33.1% 9.6% 157BNZ 48.3% 40.8% 10.8% 120Westpac 48.7% 39.1% 12.2% 230Other 39.4% 44.9% 15.7% 254Total Sample 47.3% 40.0% 12.6% 761Table 10: Responses to closeness of relationship with main bank© Libraries and Learning Services - Student Learning Services (Tā te Ākonga) Page 36 of 44The University of Auckland


