

STATISTICS â UNDERSTANDING HYPOTHESIS TESTS
STATISTICS â UNDERSTANDING HYPOTHESIS TESTS
STATISTICS â UNDERSTANDING HYPOTHESIS TESTS

You also want an ePaper? Increase the reach of your titles
YUMPU automatically turns print PDFs into web optimized ePapers that Google loves.
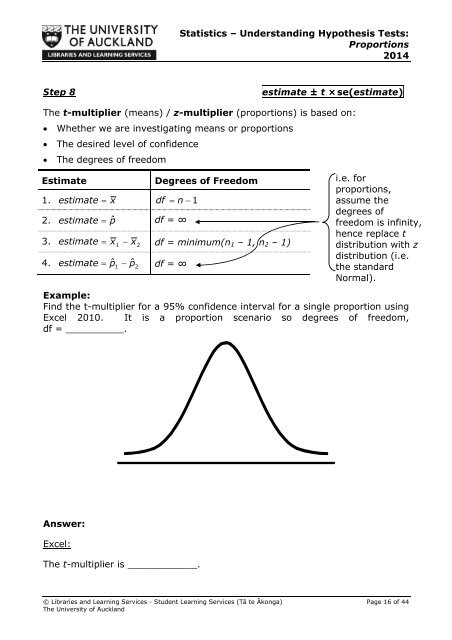
Statistics – Understanding Hypothesis Tests:Proportions2014Step 8estimate ± t ×se(estimate)The t-multiplier (means) / z-multiplier (proportions) is based on: Whether we are investigating means or proportions The desired level of confidence The degrees of freedomEstimateDegrees of Freedom1. estimate x df n 12. estimate pˆdf = ∞3. estimate x 1 x2df = minimum(n 1 – 1, n 2 – 1)4. estimate pˆˆ1 p2df = ∞i.e. forproportions,assume thedegrees offreedom is infinity,hence replace tdistribution with zdistribution (i.e.the standardNormal).Example:Find the t-multiplier for a 95% confidence interval for a single proportion usingExcel 2010. It is a proportion scenario so degrees of freedom,df = __________.Answer:Excel:The t-multiplier is ____________.© Libraries and Learning Services - Student Learning Services (Tā te Ākonga) Page 16 of 44The University of Auckland


