STATISTICS â UNDERSTANDING HYPOTHESIS TESTS
STATISTICS â UNDERSTANDING HYPOTHESIS TESTS
STATISTICS â UNDERSTANDING HYPOTHESIS TESTS
You also want an ePaper? Increase the reach of your titles
YUMPU automatically turns print PDFs into web optimized ePapers that Google loves.
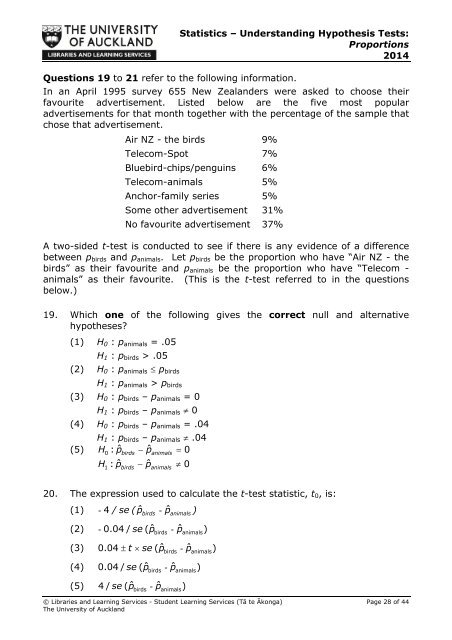
Statistics – Understanding Hypothesis Tests:Proportions2014Questions 19 to 21 refer to the following information.In an April 1995 survey 655 New Zealanders were asked to choose theirfavourite advertisement. Listed below are the five most popularadvertisements for that month together with the percentage of the sample thatchose that advertisement.Air NZ - the birds 9%Telecom-Spot 7%Bluebird-chips/penguins 6%Telecom-animals 5%Anchor-family series 5%Some other advertisement 31%No favourite advertisement 37%A two-sided t-test is conducted to see if there is any evidence of a differencebetween p birds and p animals . Let p birds be the proportion who have “Air NZ - thebirds” as their favourite and p animals be the proportion who have “Telecom -animals” as their favourite. (This is the t-test referred to in the questionsbelow.)19. Which one of the following gives the correct null and alternativehypotheses?(1) H 0 : p animals = .05H 1 : p birds > .05(2) H 0 : p animals p birdsH 1 : p animals > p birds(3) H 0 : p birds – p animals = 0H 1 : p birds – p animals 0(4) H 0 : p birds – p animals = .04H 1 : p birds – p animals .04(5) H : ˆ ˆ0p birds p animals 0H : pˆbirds pˆ01 animals20. The expression used to calculate the t-test statistic, t 0 , is:(1) - 4 se (pˆ pˆ )/birds-animals(2) - .04 / se (ˆ p birds- pˆ)0animals(3) .04 t se (ˆ p birds- pˆ)0animals(4) .04 / se (ˆ p birds- pˆ)0animals(5) / se (ˆ p birds- pˆ)4animals© Libraries and Learning Services - Student Learning Services (Tā te Ākonga) Page 28 of 44The University of Auckland


