

STATISTICS â UNDERSTANDING HYPOTHESIS TESTS
STATISTICS â UNDERSTANDING HYPOTHESIS TESTS
STATISTICS â UNDERSTANDING HYPOTHESIS TESTS

You also want an ePaper? Increase the reach of your titles
YUMPU automatically turns print PDFs into web optimized ePapers that Google loves.
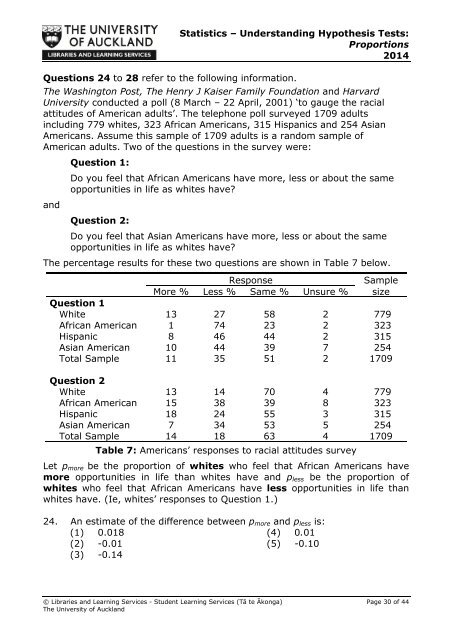
Statistics – Understanding Hypothesis Tests:Proportions2014Questions 24 to 28 refer to the following information.The Washington Post, The Henry J Kaiser Family Foundation and HarvardUniversity conducted a poll (8 March – 22 April, 2001) ‘to gauge the racialattitudes of American adults’. The telephone poll surveyed 1709 adultsincluding 779 whites, 323 African Americans, 315 Hispanics and 254 AsianAmericans. Assume this sample of 1709 adults is a random sample ofAmerican adults. Two of the questions in the survey were:Question 1:Do you feel that African Americans have more, less or about the sameopportunities in life as whites have?andQuestion 2:Do you feel that Asian Americans have more, less or about the sameopportunities in life as whites have?The percentage results for these two questions are shown in Table 7 below.ResponseSampleMore % Less % Same % Unsure % sizeQuestion 1White 13 27 58 2 779African American 1 74 23 2 323Hispanic 8 46 44 2 315Asian American 10 44 39 7 254Total Sample 11 35 51 2 1709Question 2White 13 14 70 4 779African American 15 38 39 8 323Hispanic 18 24 55 3 315Asian American 7 34 53 5 254Total Sample 14 18 63 4 1709Table 7: Americans’ responses to racial attitudes surveyLet p more be the proportion of whites who feel that African Americans havemore opportunities in life than whites have and p less be the proportion ofwhites who feel that African Americans have less opportunities in life thanwhites have. (Ie, whites’ responses to Question 1.)24. An estimate of the difference between p more and p less is:(1) 0.018(4) 0.01(2) -0.01(5) -0.10(3) -0.14© Libraries and Learning Services - Student Learning Services (Tā te Ākonga) Page 30 of 44The University of Auckland


