The City of Hilliard Sustainability Plan
The City of Hilliard Sustainability Plan
The City of Hilliard Sustainability Plan

You also want an ePaper? Increase the reach of your titles
YUMPU automatically turns print PDFs into web optimized ePapers that Google loves.
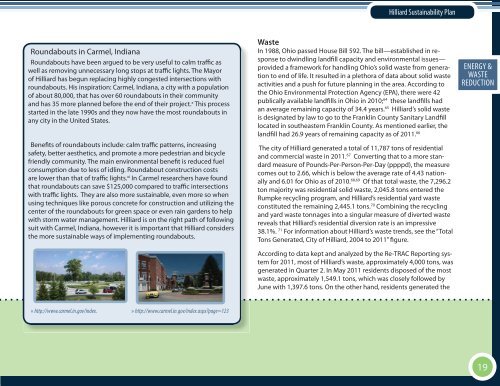
<strong>Hilliard</strong> <strong>Sustainability</strong> <strong>Plan</strong>Roundabouts in Carmel, IndianaRoundabouts have been argued to be very useful to calm traffic aswell as removing unnecessary long stops at traffic lights. <strong>The</strong> Mayor<strong>of</strong> <strong>Hilliard</strong> has begun replacing highly congested intersections withroundabouts. His inspiration: Carmel, Indiana, a city with a population<strong>of</strong> about 80,000, that has over 60 roundabouts in their communityand has 35 more planned before the end <strong>of</strong> their project. x This processstarted in the late 1990s and they now have the most roundabouts inany city in the United States.Benefits <strong>of</strong> roundabouts include: calm traffic patterns, increasingsafety, better aesthetics, and promote a more pedestrian and bicyclefriendly community. <strong>The</strong> main environmental benefit is reduced fuelconsumption due to less <strong>of</strong> idling. Roundabout construction costsare lower than that <strong>of</strong> traffic lights. xi In Carmel researchers have foundthat roundabouts can save $125,000 compared to traffic intersectionswith traffic lights. <strong>The</strong>y are also more sustainable, even more so whenusing techniques like porous concrete for construction and utilizing thecenter <strong>of</strong> the roundabouts for green space or even rain gardens to helpwith storm water management. <strong>Hilliard</strong> is on the right path <strong>of</strong> followingsuit with Carmel, Indiana, however it is important that <strong>Hilliard</strong> considersthe more sustainable ways <strong>of</strong> implementing roundabouts.WasteIn 1988, Ohio passed House Bill 592. <strong>The</strong> bill—established in responseto dwindling landfill capacity and environmental issues—provided a framework for handling Ohio’s solid waste from generationto end <strong>of</strong> life. It resulted in a plethora <strong>of</strong> data about solid wasteactivities and a push for future planning in the area. According tothe Ohio Environmental Protection Agency (EPA), there were 42publically available landfills in Ohio in 2010; 64 these landfills hadan average remaining capacity <strong>of</strong> 34.4 years. 65 <strong>Hilliard</strong>’s solid wasteis designated by law to go to the Franklin County Sanitary Landfilllocated in southeastern Franklin County. As mentioned earlier, thelandfill had 26.9 years <strong>of</strong> remaining capacity as <strong>of</strong> 2011. 66<strong>The</strong> city <strong>of</strong> <strong>Hilliard</strong> generated a total <strong>of</strong> 11,787 tons <strong>of</strong> residentialand commercial waste in 2011. 67 Converting that to a more standardmeasure <strong>of</strong> Pounds-Per-Person-Per-Day (ppppd), the measurecomes out to 2.66, which is below the average rate <strong>of</strong> 4.43 nationallyand 6.01 for Ohio as <strong>of</strong> 2010. 68,69 Of that total waste, the 7,296.2ton majority was residential solid waste, 2,045.8 tons entered theRumpke recycling program, and <strong>Hilliard</strong>’s residential yard wasteconstituted the remaining 2,445.1 tons. 70 Combining the recyclingand yard waste tonnages into a singular measure <strong>of</strong> diverted wastereveals that <strong>Hilliard</strong>’s residential diversion rate is an impressive38.1%. 71 For information about <strong>Hilliard</strong>’s waste trends, see the “TotalTons Generated, <strong>City</strong> <strong>of</strong> <strong>Hilliard</strong>, 2004 to 2011” figure.According to data kept and analyzed by the Re-TRAC Reporting systemfor 2011, most <strong>of</strong> <strong>Hilliard</strong>’s waste, approximately 4,000 tons, wasgenerated in Quarter 2. In May 2011 residents disposed <strong>of</strong> the mostwaste, approximately 1,549.1 tons, which was closely followed byJune with 1,397.6 tons. On the other hand, residents generated theECON. EXECUTIVEENERGY DEV. &SOCIAL SUMMARY WASTE EQ.REDUCTION» http://www.carmel.in.gov/index.» http://www.carmel.in.gov/index.aspx?page=12319