The City of Hilliard Sustainability Plan
The City of Hilliard Sustainability Plan
The City of Hilliard Sustainability Plan

Create successful ePaper yourself
Turn your PDF publications into a flip-book with our unique Google optimized e-Paper software.
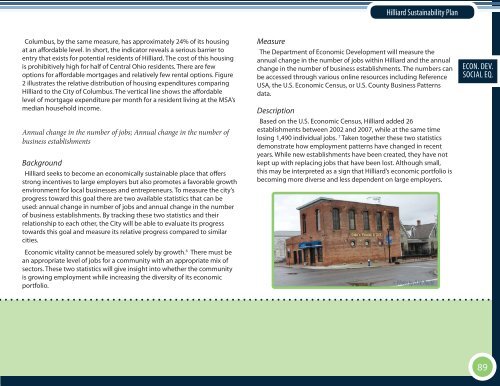
<strong>Hilliard</strong> <strong>Sustainability</strong> <strong>Plan</strong>Columbus, by the same measure, has approximately 24% <strong>of</strong> its housingat an affordable level. In short, the indicator reveals a serious barrier toentry that exists for potential residents <strong>of</strong> <strong>Hilliard</strong>. <strong>The</strong> cost <strong>of</strong> this housingis prohibitively high for half <strong>of</strong> Central Ohio residents. <strong>The</strong>re are fewoptions for affordable mortgages and relatively few rental options. Figure2 illustrates the relative distribution <strong>of</strong> housing expenditures comparing<strong>Hilliard</strong> to the <strong>City</strong> <strong>of</strong> Columbus. <strong>The</strong> vertical line shows the affordablelevel <strong>of</strong> mortgage expenditure per month for a resident living at the MSA’smedian household income.Annual change in the number <strong>of</strong> jobs; Annual change in the number <strong>of</strong>business establishmentsBackground<strong>Hilliard</strong> seeks to become an economically sustainable place that <strong>of</strong>fersstrong incentives to large employers but also promotes a favorable growthenvironment for local businesses and entrepreneurs. To measure the city’sprogress toward this goal there are two available statistics that can beused: annual change in number <strong>of</strong> jobs and annual change in the number<strong>of</strong> business establishments. By tracking these two statistics and theirrelationship to each other, the <strong>City</strong> will be able to evaluate its progresstowards this goal and measure its relative progress compared to similarcities.Economic vitality cannot be measured solely by growth. 6 <strong>The</strong>re must bean appropriate level <strong>of</strong> jobs for a community with an appropriate mix <strong>of</strong>sectors. <strong>The</strong>se two statistics will give insight into whether the communityis growing employment while increasing the diversity <strong>of</strong> its economicportfolio.Measure<strong>The</strong> Department <strong>of</strong> Economic Development will measure theannual change in the number <strong>of</strong> jobs within <strong>Hilliard</strong> and the annualchange in the number <strong>of</strong> business establishments. <strong>The</strong> numbers canbe accessed through various online resources including ReferenceUSA, the U.S. Economic Census, or U.S. County Business Patternsdata.DescriptionBased on the U.S. Economic Census, <strong>Hilliard</strong> added 26establishments between 2002 and 2007, while at the same timelosing 1,490 individual jobs. 7 Taken together these two statisticsdemonstrate how employment patterns have changed in recentyears. While new establishments have been created, they have notkept up with replacing jobs that have been lost. Although small,this may be interpreted as a sign that <strong>Hilliard</strong>’s economic portfolio isbecoming more diverse and less dependent on large employers.» Photo by D.W. RouteECON. EXECUTIVE DEV.SOCIAL SUMMARY EQ.89