<strong>Hilliard</strong> <strong>Sustainability</strong> <strong>Plan</strong>Social EquitySocial equity can be a difficult and somewhat intangible concept tomeasure for a city. This concept can be especially challenging to gaugein suburban communities with smaller populations and an existinghomogeneous demographic pr<strong>of</strong>ile. Often social equity is viewedthrough the lens <strong>of</strong> closing the gap between wealthy and upper-middleclass constituencies and working class and lower-middle class groups.This perspective may not make sense in suburban communities such as<strong>Hilliard</strong> because they <strong>of</strong>ten have median incomes above average for theirmetropolitan statistical area (MSA) and less economic and ethnic diversity.When examining social equity in <strong>Hilliard</strong>, it may be most important toconsider building a more diverse community in a sustainable manner.Sustainable communities support a range <strong>of</strong> people and economic classesas opposed to enclaves <strong>of</strong> one particular social or economic group. 38 One<strong>of</strong> the most tangible measures in this area can be in terms <strong>of</strong> the housingstock <strong>of</strong>fered in the community. Before a community can open its doorsto different groups <strong>of</strong> people, there must be an available housing stocksuitable to different needs.If a community seeks sustainable growth, they must be open to beinghome to more diverse constituencies <strong>of</strong> people, including those <strong>of</strong> varyingeconomic levels. In <strong>Hilliard</strong>, the average home value is significantly higherthan average for the Ohio and the Columbus MSA. 39 <strong>The</strong> median value<strong>of</strong> a home in <strong>Hilliard</strong> is $209,300, while the average for the state <strong>of</strong> Ohiois $136,400. 40 While this can be viewed as an indicator <strong>of</strong> success, it ismore likely that it is a product <strong>of</strong> self-selection. Rather than there beingsomething tangible about <strong>Hilliard</strong> that makes its people more economicallysuccessful, it is more likely that <strong>Hilliard</strong> is a community that is more narrowlyhospitable to one particular economic group considering both the aboveaverage median household income and housing prices in <strong>Hilliard</strong> ascompared to the rest <strong>of</strong> the MSA .If <strong>Hilliard</strong> wants to be a vibrant city, it will have to <strong>of</strong>fer a widerrange <strong>of</strong> jobs and housing opportunities that make the cityattractive to different groups <strong>of</strong> people. 41 To accommodate thisgrowth, one <strong>of</strong> the first ingredients will have to be a more diverseportfolio <strong>of</strong> housing opportunities. <strong>The</strong> larger, high-end homes thatare currently the norm in <strong>Hilliard</strong> are in over-abundance and surveysshow they are not as desirable for younger people. 42 Unless <strong>Hilliard</strong>adapts now to this growing trend away from the predominanthousing type in <strong>Hilliard</strong>, the city will risk sharp population decline inthe future.In order to compete for future residents, <strong>Hilliard</strong> must recognizenow that two <strong>of</strong> the key demographics that can help maintainpopulation and build the city’s future are young pr<strong>of</strong>essionals andyoung families. While it may be difficult for <strong>Hilliard</strong> to competewith Columbus in terms <strong>of</strong> securing young pr<strong>of</strong>essionals who maybe attracted to the social, entertainment, and cultural amenitiesthat can only be <strong>of</strong>fered by a large city, <strong>Hilliard</strong> could certainly bewell-positioned to compete for young families because <strong>of</strong> the city’sstrong school district. 43 In order to successfully compete for youngcouples and families, it is important to <strong>of</strong>fer a housing stock that issuitable for the incomes <strong>of</strong> young couples and families.Providing housing options that are accessible to young coupleswith or without children is one way to attract residents who canmove into the community and build a future in <strong>Hilliard</strong>. As itcurrently stands, the homeownership rate in <strong>Hilliard</strong> is 78%, wellabove the Ohio average <strong>of</strong> 69.2%. 44 While a robust homeownershiprate is generally a positive, one reason for this high rate may bethat the median household income for <strong>Hilliard</strong> residents is $81,933ECON. EXECUTIVE DEV.SOCIAL SUMMARY EQ.If <strong>Hilliard</strong> wants to be a vibrant city, it will have to <strong>of</strong>fer a wider range <strong>of</strong>jobs and housing opportunities that make the city attractive to differentgroups <strong>of</strong> people.97
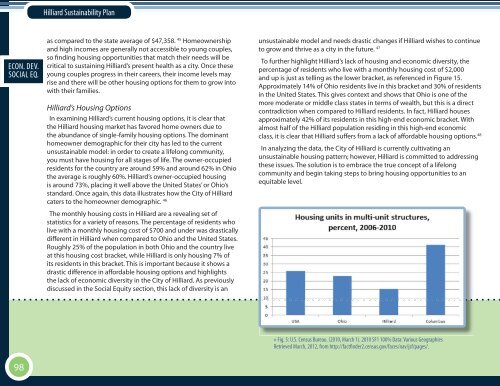
<strong>Hilliard</strong> <strong>Sustainability</strong> <strong>Plan</strong>ECON. EXECUTIVE DEV.SOCIAL SUMMARY EQ.as compared to the state average <strong>of</strong> $47,358. 45 Homeownershipand high incomes are generally not accessible to young couples,so finding housing opportunities that match their needs will becritical to sustaining <strong>Hilliard</strong>’s present health as a city. Once theseyoung couples progress in their careers, their income levels mayrise and there will be other housing options for them to grow intowith their families.<strong>Hilliard</strong>’s Housing OptionsIn examining <strong>Hilliard</strong>’s current housing options, it is clear thatthe <strong>Hilliard</strong> housing market has favored home owners due tothe abundance <strong>of</strong> single-family housing options. <strong>The</strong> dominanthomeowner demographic for their city has led to the currentunsustainable model: in order to create a lifelong community,you must have housing for all stages <strong>of</strong> life. <strong>The</strong> owner-occupiedresidents for the country are around 59% and around 62% in Ohiothe average is roughly 60%. <strong>Hilliard</strong>’s owner-occupied housingis around 73%, placing it well above the United States’ or Ohio’sstandard. Once again, this data illustrates how the <strong>City</strong> <strong>of</strong> <strong>Hilliard</strong>caters to the homeowner demographic. 46<strong>The</strong> monthly housing costs in <strong>Hilliard</strong> are a revealing set <strong>of</strong>statistics for a variety <strong>of</strong> reasons. <strong>The</strong> percentage <strong>of</strong> residents wholive with a monthly housing cost <strong>of</strong> $700 and under was drasticallydifferent in <strong>Hilliard</strong> when compared to Ohio and the United States.Roughly 25% <strong>of</strong> the population in both Ohio and the country liveat this housing cost bracket, while <strong>Hilliard</strong> is only housing 7% <strong>of</strong>its residents in this bracket. This is important because it shows adrastic difference in affordable housing options and highlightsthe lack <strong>of</strong> economic diversity in the <strong>City</strong> <strong>of</strong> <strong>Hilliard</strong>. As previouslydiscussed in the Social Equity section, this lack <strong>of</strong> diversity is anunsustainable model and needs drastic changes if <strong>Hilliard</strong> wishes to continueto grow and thrive as a city in the future. 47To further highlight <strong>Hilliard</strong>’s lack <strong>of</strong> housing and economic diversity, thepercentage <strong>of</strong> residents who live with a monthly housing cost <strong>of</strong> $2,000and up is just as telling as the lower bracket, as referenced in Figure 15.Approximately 14% <strong>of</strong> Ohio residents live in this bracket and 30% <strong>of</strong> residentsin the United States. This gives context and shows that Ohio is one <strong>of</strong> themore moderate or middle class states in terms <strong>of</strong> wealth, but this is a directcontradiction when compared to <strong>Hilliard</strong> residents. In fact, <strong>Hilliard</strong> housesapproximately 42% <strong>of</strong> its residents in this high-end economic bracket. Withalmost half <strong>of</strong> the <strong>Hilliard</strong> population residing in this high-end economicclass, it is clear that <strong>Hilliard</strong> suffers from a lack <strong>of</strong> affordable housing options. 48In analyzing the data, the <strong>City</strong> <strong>of</strong> <strong>Hilliard</strong> is currently cultivating anunsustainable housing pattern; however, <strong>Hilliard</strong> is committed to addressingthese issues. <strong>The</strong> solution is to embrace the true concept <strong>of</strong> a lifelongcommunity and begin taking steps to bring housing opportunities to anequitable level.» Fig. 5: U.S. Census Bureau. (2010, March 1). 2010 SF1 100% Data: Various GeographiesRetrieved March, 2012, from http://factfinder2.census.gov/faces/nav/jsf/pages/.98