The City of Hilliard Sustainability Plan
The City of Hilliard Sustainability Plan
The City of Hilliard Sustainability Plan

You also want an ePaper? Increase the reach of your titles
YUMPU automatically turns print PDFs into web optimized ePapers that Google loves.
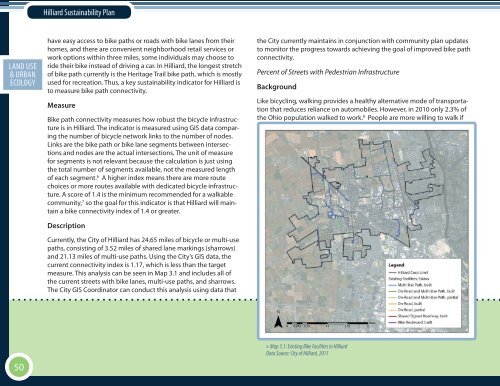
<strong>Hilliard</strong> <strong>Sustainability</strong> <strong>Plan</strong>ECON. EXECUTIVELAND USE DEV.SOCIAL SUMMARY& URBAN EQ.ECOLOGYhave easy access to bike paths or roads with bike lanes from theirhomes, and there are convenient neighborhood retail services orwork options within three miles, some individuals may choose toride their bike instead <strong>of</strong> driving a car. In <strong>Hilliard</strong>, the longest stretch<strong>of</strong> bike path currently is the Heritage Trail bike path, which is mostlyused for recreation. Thus, a key sustainability indicator for <strong>Hilliard</strong> isto measure bike path connectivity.MeasureBike path connectivity measures how robust the bicycle infrastructureis in <strong>Hilliard</strong>. <strong>The</strong> indicator is measured using GIS data comparingthe number <strong>of</strong> bicycle network links to the number <strong>of</strong> nodes.Links are the bike path or bike lane segments between intersectionsand nodes are the actual intersections. <strong>The</strong> unit <strong>of</strong> measurefor segments is not relevant because the calculation is just usingthe total number <strong>of</strong> segments available, not the measured length<strong>of</strong> each segment. 6 A higher index means there are more routechoices or more routes available with dedicated bicycle infrastructure.A score <strong>of</strong> 1.4 is the minimum recommended for a walkablecommunity, 7 so the goal for this indicator is that <strong>Hilliard</strong> will maintaina bike connectivity index <strong>of</strong> 1.4 or greater.DescriptionCurrently, the <strong>City</strong> <strong>of</strong> <strong>Hilliard</strong> has 24.65 miles <strong>of</strong> bicycle or multi-usepaths, consisting <strong>of</strong> 3.52 miles <strong>of</strong> shared lane markings (sharrows)and 21.13 miles <strong>of</strong> multi-use paths. Using the <strong>City</strong>’s GIS data, thecurrent connectivity index is 1.17, which is less than the targetmeasure. This analysis can be seen in Map 3.1 and includes all <strong>of</strong>the current streets with bike lanes, multi-use paths, and sharrows.<strong>The</strong> <strong>City</strong> GIS Coordinator can conduct this analysis using data thatthe <strong>City</strong> currently maintains in conjunction with community plan updatesto monitor the progress towards achieving the goal <strong>of</strong> improved bike pathconnectivity.Percent <strong>of</strong> Streets with Pedestrian InfrastructureBackgroundLike bicycling, walking provides a healthy alternative mode <strong>of</strong> transportationthat reduces reliance on automobiles. However, in 2010 only 2.3% <strong>of</strong>the Ohio population walked to work. 8 People are more willing to walk if50» Map 3.1: Existing Bike Facilities in <strong>Hilliard</strong>Data Source: <strong>City</strong> <strong>of</strong> <strong>Hilliard</strong>, 2011