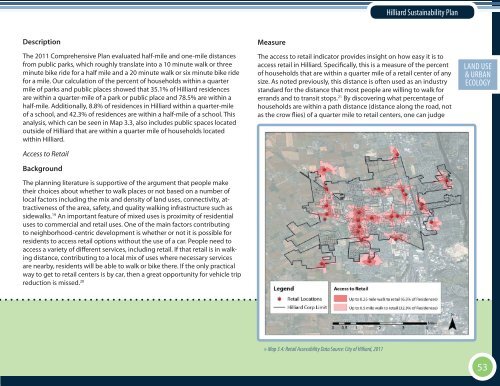
<strong>Hilliard</strong> <strong>Sustainability</strong> <strong>Plan</strong>Description<strong>The</strong> 2011 Comprehensive <strong>Plan</strong> evaluated half-mile and one-mile distancesfrom public parks, which roughly translate into a 10 minute walk or threeminute bike ride for a half mile and a 20 minute walk or six minute bike ridefor a mile. Our calculation <strong>of</strong> the percent <strong>of</strong> households within a quartermile <strong>of</strong> parks and public places showed that 35.1% <strong>of</strong> <strong>Hilliard</strong> residencesare within a quarter-mile <strong>of</strong> a park or public place and 78.5% are within ahalf-mile. Additionally, 8.8% <strong>of</strong> residences in <strong>Hilliard</strong> within a quarter-mile<strong>of</strong> a school, and 42.3% <strong>of</strong> residences are within a half-mile <strong>of</strong> a school. Thisanalysis, which can be seen in Map 3.3, also includes public spaces locatedoutside <strong>of</strong> <strong>Hilliard</strong> that are within a quarter mile <strong>of</strong> households locatedwithin <strong>Hilliard</strong>.Access to RetailBackground<strong>The</strong> planning literature is supportive <strong>of</strong> the argument that people maketheir choices about whether to walk places or not based on a number <strong>of</strong>local factors including the mix and density <strong>of</strong> land uses, connectivity, attractiveness<strong>of</strong> the area, safety, and quality walking infrastructure such assidewalks. 19 An important feature <strong>of</strong> mixed uses is proximity <strong>of</strong> residentialuses to commercial and retail uses. One <strong>of</strong> the main factors contributingto neighborhood-centric development is whether or not it is possible forresidents to access retail options without the use <strong>of</strong> a car. People need toaccess a variety <strong>of</strong> different services, including retail. If that retail is in walkingdistance, contributing to a local mix <strong>of</strong> uses where necessary servicesare nearby, residents will be able to walk or bike there. If the only practicalway to get to retail centers is by car, then a great opportunity for vehicle tripreduction is missed. 20Measure<strong>The</strong> access to retail indicator provides insight on how easy it is toaccess retail in <strong>Hilliard</strong>. Specifically, this is a measure <strong>of</strong> the percent<strong>of</strong> households that are within a quarter mile <strong>of</strong> a retail center <strong>of</strong> anysize. As noted previously, this distance is <strong>of</strong>ten used as an industrystandard for the distance that most people are willing to walk forerrands and to transit stops. 21 By discovering what percentage <strong>of</strong>households are within a path distance (distance along the road, notas the crow flies) <strong>of</strong> a quarter mile to retail centers, one can judgeECON. EXECUTIVELAND DEV. USESOCIAL SUMMARY& URBAN EQ.ECOLOGY» Map 3.4: Retail Accessibility Data Source: <strong>City</strong> <strong>of</strong> <strong>Hilliard</strong>, 201153
<strong>Hilliard</strong> <strong>Sustainability</strong> <strong>Plan</strong>ECON. EXECUTIVELAND USE DEV.SOCIAL SUMMARY& URBAN EQ.ECOLOGYto what extent the residents <strong>of</strong> <strong>Hilliard</strong> are encouraged or discouragedfrom walking based on distance.DescriptionThis measure can be calculated by the <strong>City</strong> GIS Coordinator usingexisting street network data. <strong>The</strong> Network Analyst tool in ArcGIS(or other similarly named tools in other GIS s<strong>of</strong>tware) calculateswalking or biking distance along existing paths to the nearest retailcenter for each residential parcel. A similar measure was used inthe <strong>City</strong>’s recent Comprehensive <strong>Plan</strong> to calculate half-mile andone-mile distances to retail centers. This measure includes majorretail centers that are just beyond the <strong>Hilliard</strong> border that are stillwithin walking distance <strong>of</strong> <strong>Hilliard</strong> residents. Currently, 6.5% <strong>of</strong><strong>Hilliard</strong> residences (612 out <strong>of</strong> 9444) are within a quarter-mile <strong>of</strong> aretail center <strong>of</strong> any size, and 32.3% (3046 out <strong>of</strong> 9444) are withina half-mile <strong>of</strong> a retail center as shown in Map 3.4. As time goes onand the measure is repeated, <strong>Hilliard</strong> should strive to show meaningfulprogress each year. For comparison, Issaquah, Washington (asimilarly sized city) has 25% <strong>of</strong> residences located within a quartermile <strong>of</strong> retail. 22 While it is difficult to come up with an exact numberthat would be appropriate for <strong>Hilliard</strong> to work towards, thisexample shows that cities <strong>of</strong> a similar size to <strong>Hilliard</strong> can achievemuch higher percentages than the current values seen in <strong>Hilliard</strong>.Within the current economic climate, there may be slow progresson this indicator initially; however, the city should aim for constantgains in the percentage <strong>of</strong> households within walking distance <strong>of</strong> aretail center.LUUE Opportunity AssessmentUrban ecology is the study <strong>of</strong> the natural environment and the waysin which the natural environment interacts with the urban environment.23 Land use is the human alteration <strong>of</strong> the natural environmentinto built environment, and refers to everything from pasture andcrop land to city developments. Land use has major impacts on urbanecology, and in a sustainable community, the two are balancedso that human development does not overwhelm nature. In turn,a robust urban ecology can help communities be healthier, moresocial, and more sustainable.Current Development Patterns<strong>Hilliard</strong>’s development pattern was historically agricultural with a small villagecenter surrounding its railroad station. This small village center is nowOld <strong>Hilliard</strong>, and development in <strong>Hilliard</strong> has dramatically changed over thepast 50 years. Connection to the Columbus regional sewer and water systemin the late 1950s brought explosive growth to <strong>Hilliard</strong>, vastly expandingthe city’s footprint beyond Old <strong>Hilliard</strong>. 24 <strong>The</strong> <strong>City</strong> grew from a population<strong>of</strong> 610 in 1950 to 5,633 in 1960. 25 This resulted in the conversion <strong>of</strong> farmlots into new residential subdivisions, creating a patchwork <strong>of</strong> residential,commercial, and industrial developments. 26 This pattern included a strongseparation <strong>of</strong> land uses, new centers <strong>of</strong> retail activity, an automobile-scalebuilt environment, and low density development. 27 <strong>Hilliard</strong>’s next majorhousing boom occurred between 1990 and 2000 sparked by the construction<strong>of</strong> I-270. During this period the population more than doubled from11,579 to 24,230. 28 However, the development pattern stayed the same asmore low-density housing subdivisions were created. Due in part to the recentrecession, development in <strong>Hilliard</strong> during the past decade has slowed54