- Page 4 and 5: CONTRIBUTORSLOUIS ADAMS, PH.D. Prof
- Page 6 and 7: CONTENTSPREFACExvACKNOWLEDGMENTSxvi
- Page 8 and 9: CONTENTSix7.3 Agents that Act on th
- Page 10 and 11: CONTENTSxi15.4 Herbicides 35615.5 F
- Page 12 and 13: CONTENTSxiii21.6 Population Issues
- Page 14 and 15: xviPREFACE• The approach is scien
- Page 16 and 17: PRINCIPLES OF TOXICOLOGY
- Page 18 and 19: 1 General Principles of ToxicologyG
- Page 20 and 21: 1.2 WHAT TOXICOLOGISTS STUDY 5Delay
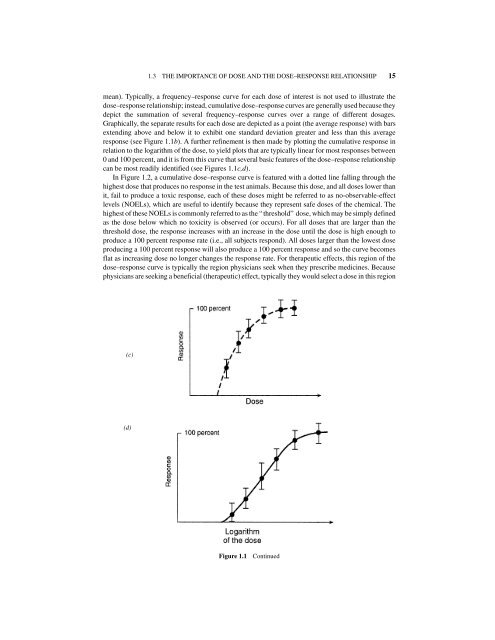
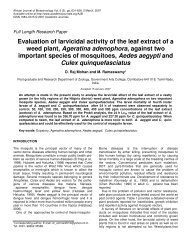
- Page 22 and 23: 1.3 THE IMPORTANCE OF DOSE AND THE
- Page 24 and 25: 1.3 THE IMPORTANCE OF DOSE AND THE
- Page 26 and 27: 1.3 THE IMPORTANCE OF DOSE AND THE
- Page 28 and 29: 1.3 THE IMPORTANCE OF DOSE AND THE
- Page 32 and 33: 1.4 HOW DOSE-RESPONSE DATA CAN BE U
- Page 34 and 35: 1.5 AVOIDING INCORRECT CONCLUSIONS
- Page 36 and 37: 1.6 FACTORS INFLUENCING DOSE-RESPON
- Page 38: 1.6 FACTORS INFLUENCING DOSE-RESPON
- Page 41 and 42: 26 GENERAL PRINCIPLES OF TOXICOLOGY
- Page 43 and 44: 28 GENERAL PRINCIPLES OF TOXICOLOGY
- Page 45 and 46: 30 GENERAL PRINCIPLES OF TOXICOLOGY
- Page 47 and 48: 32 GENERAL PRINCIPLES OF TOXICOLOGY
- Page 49 and 50: 34 GENERAL PRINCIPLES OF TOXICOLOGY
- Page 51 and 52: 36 ABSORPTION, DISTRIBUTION, AND EL
- Page 53 and 54: 38 ABSORPTION, DISTRIBUTION, AND EL
- Page 55 and 56: 40 ABSORPTION, DISTRIBUTION, AND EL
- Page 57 and 58: 42 ABSORPTION, DISTRIBUTION, AND EL
- Page 59 and 60: 44 ABSORPTION, DISTRIBUTION, AND EL
- Page 62 and 63: 2.4 DISPOSITION: DISTRIBUTION AND E
- Page 64 and 65: 2.4 DISPOSITION: DISTRIBUTION AND E
- Page 66 and 67: 2.4 DISPOSITION: DISTRIBUTION AND E
- Page 68 and 69: 2.5 SUMMARY 53the transfer from liv
- Page 70 and 71: REFERENCES AND SUGGESTED READING 55
- Page 72 and 73: 58 BIOTRANSFORMATION: A BALANCE BET
- Page 74 and 75: 60Figure 3.3 Xenobiotic metabolism
- Page 76 and 77: 62 BIOTRANSFORMATION: A BALANCE BET
- Page 78 and 79: 64 BIOTRANSFORMATION: A BALANCE BET
- Page 80 and 81:
66 BIOTRANSFORMATION: A BALANCE BET
- Page 82 and 83:
TABLE 3.4 Important Cytochrome P450
- Page 84 and 85:
70 BIOTRANSFORMATION: A BALANCE BET
- Page 86 and 87:
72 BIOTRANSFORMATION: A BALANCE BET
- Page 88 and 89:
74 BIOTRANSFORMATION: A BALANCE BET
- Page 90 and 91:
76 BIOTRANSFORMATION: A BALANCE BET
- Page 92 and 93:
78 BIOTRANSFORMATION: A BALANCE BET
- Page 94 and 95:
80 BIOTRANSFORMATION: A BALANCE BET
- Page 96 and 97:
82 BIOTRANSFORMATION: A BALANCE BET
- Page 98 and 99:
84 BIOTRANSFORMATION: A BALANCE BET
- Page 100 and 101:
86 BIOTRANSFORMATION: A BALANCE BET
- Page 102 and 103:
88 HEMATOTOXICITY: CHEMICALLY INDUC
- Page 104 and 105:
90 HEMATOTOXICITY: CHEMICALLY INDUC
- Page 106 and 107:
92 HEMATOTOXICITY: CHEMICALLY INDUC
- Page 108 and 109:
94 HEMATOTOXICITY: CHEMICALLY INDUC
- Page 110 and 111:
96 HEMATOTOXICITY: CHEMICALLY INDUC
- Page 112 and 113:
98 HEMATOTOXICITY: CHEMICALLY INDUC
- Page 114 and 115:
100 HEMATOTOXICITY: CHEMICALLY INDU
- Page 116 and 117:
102 HEMATOTOXICITY: CHEMICALLY INDU
- Page 118 and 119:
104 HEMATOTOXICITY: CHEMICALLY INDU
- Page 120 and 121:
106 HEMATOTOXICITY: CHEMICALLY INDU
- Page 122 and 123:
108 HEMATOTOXICITY: CHEMICALLY INDU
- Page 124 and 125:
5 Hepatotoxicity: Toxic Effects on
- Page 126 and 127:
5.1 THE PHYSIOLOGIC AND MORPHOLOGIC
- Page 128 and 129:
5.1 THE PHYSIOLOGIC AND MORPHOLOGIC
- Page 130 and 131:
5.2 TYPES OF LIVER INJURY 117cause
- Page 132 and 133:
5.2 TYPES OF LIVER INJURY 119Exampl
- Page 134 and 135:
5.2 TYPES OF LIVER INJURY 121TABLE
- Page 136 and 137:
5.2 TYPES OF LIVER INJURY 123to pro
- Page 138 and 139:
5.3 EVALUATION OF LIVER INJURY 125f
- Page 140 and 141:
REFERENCES AND SUGGESTED READING 12
- Page 142 and 143:
6 Nephrotoxicity: Toxic Responses o
- Page 144 and 145:
6.1 BASIC KIDNEY STRUCTURES AND FUN
- Page 146 and 147:
6.1 BASIC KIDNEY STRUCTURES AND FUN
- Page 148 and 149:
6.2 FUNCTIONAL MEASUREMENTS TO EVAL
- Page 150 and 151:
6.3 ADVERSE EFFECTS OF CHEMICALS ON
- Page 152 and 153:
6.3 ADVERSE EFFECTS OF CHEMICALS ON
- Page 154 and 155:
6.3 ADVERSE EFFECTS OF CHEMICALS ON
- Page 156 and 157:
REFERENCES AND SUGGESTED READING 14
- Page 158 and 159:
146 NEUROTOXICITY: TOXIC RESPONSES
- Page 160 and 161:
148 NEUROTOXICITY: TOXIC RESPONSES
- Page 162 and 163:
150 NEUROTOXICITY: TOXIC RESPONSES
- Page 164 and 165:
152 NEUROTOXICITY: TOXIC RESPONSES
- Page 166 and 167:
154 NEUROTOXICITY: TOXIC RESPONSES
- Page 168 and 169:
8 Dermal and Ocular Toxicology: Tox
- Page 170 and 171:
8.2 FUNCTIONS 159corneum is the pri
- Page 172 and 173:
8.3 CONTACT DERMATITIS 161TABLE 8.2
- Page 174 and 175:
8.3 CONTACT DERMATITIS 163mucous me
- Page 176 and 177:
8.3 CONTACT DERMATITIS 165light to
- Page 178 and 179:
8.4 SUMMARY 167The structure of the
- Page 180 and 181:
9 Pulmonotoxicity: Toxic Effects in
- Page 182 and 183:
9.1 LUNG ANATOMY AND PHYSIOLOGY 171
- Page 184 and 185:
9.1 LUNG ANATOMY AND PHYSIOLOGY 173
- Page 186 and 187:
9.1 LUNG ANATOMY AND PHYSIOLOGY 175
- Page 188 and 189:
9.1 LUNG ANATOMY AND PHYSIOLOGY 177
- Page 190 and 191:
9.1 LUNG ANATOMY AND PHYSIOLOGY 179
- Page 192 and 193:
9.2 MECHANISMS OF INDUSTRIALLY RELA
- Page 194 and 195:
9.2 MECHANISMS OF INDUSTRIALLY RELA
- Page 196 and 197:
9.3 SUMMARY 185Industrially Related
- Page 198 and 199:
REFERENCES AND SUGGESTED READING 18
- Page 200 and 201:
190 IMMUNOTOXICITY: TOXIC EFFECTS O
- Page 202 and 203:
192 IMMUNOTOXICITY: TOXIC EFFECTS O
- Page 204 and 205:
194 IMMUNOTOXICITY: TOXIC EFFECTS O
- Page 206 and 207:
196 IMMUNOTOXICITY: TOXIC EFFECTS O
- Page 208 and 209:
198 IMMUNOTOXICITY: TOXIC EFFECTS O
- Page 210 and 211:
200 IMMUNOTOXICITY: TOXIC EFFECTS O
- Page 212 and 213:
202 IMMUNOTOXICITY: TOXIC EFFECTS O
- Page 214 and 215:
204 IMMUNOTOXICITY: TOXIC EFFECTS O
- Page 216 and 217:
206 IMMUNOTOXICITY: TOXIC EFFECTS O
- Page 218 and 219:
11 Reproductive ToxicologyREPRODUCT
- Page 220 and 221:
11.1 MALE REPRODUCTIVE TOXICOLOGY 2
- Page 222 and 223:
11.1 MALE REPRODUCTIVE TOXICOLOGY 2
- Page 224 and 225:
11.1 MALE REPRODUCTIVE TOXICOLOGY 2
- Page 226 and 227:
11.1 MALE REPRODUCTIVE TOXICOLOGY 2
- Page 228 and 229:
11.2 FEMALE REPRODUCTIVE TOXICOLOGY
- Page 230 and 231:
11.2 FEMALE REPRODUCTIVE TOXICOLOGY
- Page 232 and 233:
11.2 FEMALE REPRODUCTIVE TOXICOLOGY
- Page 234 and 235:
11.3 DEVELOPMENTAL TOXICOLOGY 225de
- Page 236 and 237:
11.3 DEVELOPMENTAL TOXICOLOGY 227af
- Page 238 and 239:
11.3 DEVELOPMENTAL TOXICOLOGY 229ri
- Page 240 and 241:
11.3 DEVELOPMENTAL TOXICOLOGY 231to
- Page 242 and 243:
11.4 CURRENT RESEARCH CONCERNS 233T
- Page 244 and 245:
11.4 CURRENT RESEARCH CONCERNS 235
- Page 246 and 247:
REFERENCES AND SUGGESTED READING 23
- Page 248 and 249:
12 Mutagenesis and Genetic Toxicolo
- Page 250 and 251:
12.2 GENETIC FUNDAMENTALS AND EVALU
- Page 252 and 253:
TABLE 12-1. Correspondence of the G
- Page 254 and 255:
12.2 GENETIC FUNDAMENTALS AND EVALU
- Page 256 and 257:
12.2 GENETIC FUNDAMENTALS AND EVALU
- Page 258 and 259:
12.2 GENETIC FUNDAMENTALS AND EVALU
- Page 260 and 261:
12.3 NONMAMMALIAN MUTAGENICITY TEST
- Page 262 and 263:
12.4 MAMMALIAN MUTAGENICITY TESTS 2
- Page 264 and 265:
12.4 MAMMALIAN MUTAGENICITY TESTS 2
- Page 266 and 267:
12.5 OCCUPATIONAL SIGNIFICANCE OF M
- Page 268 and 269:
12.5 OCCUPATIONAL SIGNIFICANCE OF M
- Page 270 and 271:
12.5 OCCUPATIONAL SIGNIFICANCE OF M
- Page 272 and 273:
REFERENCES CITED AND SUGGESTED READ
- Page 274 and 275:
13 Chemical CarcinogenesisCHEMICAL
- Page 276 and 277:
13.1 THE TERMINOLOGY OF CANCER 267H
- Page 278 and 279:
13.3 CARCINOGENESIS BY CHEMICALS 26
- Page 280 and 281:
Figure 13.1 Schematic diagram of th
- Page 282 and 283:
13.3 CARCINOGENESIS BY CHEMICALS 27
- Page 284 and 285:
13.3 CARCINOGENESIS BY CHEMICALS 27
- Page 286 and 287:
Figure 13.4 Metabolic activation of
- Page 288 and 289:
13.3 CARCINOGENESIS BY CHEMICALS 27
- Page 290 and 291:
13.4 MOLECULAR ASPECTS OF CARCINOGE
- Page 292 and 293:
13.4 MOLECULAR ASPECTS OF CARCINOGE
- Page 294 and 295:
13.4 MOLECULAR ASPECTS OF CARCINOGE
- Page 296 and 297:
Figure 13.7 DNA damage leads to p53
- Page 298 and 299:
13.5 TESTING CHEMICALS FOR CARCINOG
- Page 300 and 301:
13.5 TESTING CHEMICALS FOR CARCINOG
- Page 302 and 303:
13.6 INTERPRETATION ISSUES RAISED B
- Page 304 and 305:
13.6 INTERPRETATION ISSUES RAISED B
- Page 306 and 307:
13.6 INTERPRETATION ISSUES RAISED B
- Page 308 and 309:
13.7 EMPIRICAL MEASURES OF RELIABIL
- Page 310 and 311:
13.8 OCCUPATIONAL CARCINOGENS 301TA
- Page 312 and 313:
13.8 OCCUPATIONAL CARCINOGENS 303TA
- Page 314 and 315:
13.9 CANCER AND OUR ENVIRONMENT 305
- Page 316 and 317:
13.9 CANCER AND OUR ENVIRONMENT 307
- Page 318 and 319:
13.9 CANCER AND OUR ENVIRONMENT 309
- Page 320 and 321:
13.9 CANCER AND OUR ENVIRONMENT 311
- Page 322 and 323:
13.9 CANCER AND OUR ENVIRONMENT 313
- Page 324 and 325:
13.9 CANCER AND OUR ENVIRONMENT 315
- Page 326 and 327:
13.9 CANCER AND OUR ENVIRONMENT 317
- Page 328 and 329:
13.10 CANCER TRENDS AND THEIR IMPAC
- Page 330 and 331:
13.11 SUMMARY 321from non-Hodgkin
- Page 332 and 333:
REFERENCES AND SUGGESTED READING 32
- Page 334 and 335:
14 Properties and Effects of Metals
- Page 336 and 337:
14.2 SPECIATION OF METALS 327Most o
- Page 338 and 339:
14.3 PHARMACOKINETICS OF METALS 329
- Page 340 and 341:
14.4 TOXICITY OF METALS 331reflex i
- Page 342 and 343:
14.4 TOXICITY OF METALS 333Several
- Page 344 and 345:
14.5 SOURCES OF METAL EXPOSURE 335H
- Page 346 and 347:
14.6 TOXICOLOGY OF SELECTED METALS
- Page 348 and 349:
14.6 TOXICOLOGY OF SELECTED METALS
- Page 350 and 351:
14.6 TOXICOLOGY OF SELECTED METALS
- Page 352 and 353:
14.7 SUMMARY 343Zinc is required fo
- Page 354 and 355:
15 Properties and Effects of Pestic
- Page 356 and 357:
15.1 ORGANOPHOSPHATE AND CARBAMATE
- Page 358 and 359:
15.1 ORGANOPHOSPHATE AND CARBAMATE
- Page 360 and 361:
15.1 ORGANOPHOSPHATE AND CARBAMATE
- Page 362 and 363:
15.3 INSECTICIDES OF BIOLOGICAL ORI
- Page 364 and 365:
15.3 INSECTICIDES OF BIOLOGICAL ORI
- Page 366 and 367:
15.4 HERBICIDES 357ClClO CH 2 C OOH
- Page 368 and 369:
15.5 FUNGICIDES 359temperatures as
- Page 370 and 371:
15.7 FUMIGANTS 361thallium sulfate-
- Page 372 and 373:
REFERENCES AND SUGGESTED READING 36
- Page 374 and 375:
REFERENCES AND SUGGESTED READING 36
- Page 376 and 377:
16 Properties and Effects of Organi
- Page 378 and 379:
TABLE 16.1 Physicochemical Properti
- Page 380 and 381:
16.2 BASIC PRINCIPLES 371TABLE 16.2
- Page 382 and 383:
16.2 BASIC PRINCIPLES 373Once absor
- Page 384 and 385:
16.2 BASIC PRINCIPLES 375the additi
- Page 386 and 387:
16.3 TOXIC PROPERTIES OF REPRESENTA
- Page 388 and 389:
16.5 TOXIC PROPERTIES OF REPRESENTA
- Page 390 and 391:
16.5 TOXIC PROPERTIES OF REPRESENTA
- Page 392 and 393:
16.6 TOXIC PROPERTIES OF REPRESENTA
- Page 394 and 395:
16.8 TOXIC PROPERTIES OF REPRESENTA
- Page 396 and 397:
16.8 TOXIC PROPERTIES OF REPRESENTA
- Page 398 and 399:
16.10 TOXIC PROPERTIES OF REPRESENT
- Page 400 and 401:
16.12 TOXIC PROPERTIES OF REPRESENT
- Page 402 and 403:
16.13 TOXIC PROPERTIES OF REPRESENT
- Page 404 and 405:
16.13 TOXIC PROPERTIES OF REPRESENT
- Page 406 and 407:
16.13 TOXIC PROPERTIES OF REPRESENT
- Page 408 and 409:
16.14 TOXIC PROPERTIES OF REPRESENT
- Page 410 and 411:
16.14 TOXIC PROPERTIES OF REPRESENT
- Page 412 and 413:
16.15 TOXIC PROPERTIES 403observed
- Page 414 and 415:
16.18 SULFUR-SUBSTITUTED SOLVENTS 4
- Page 416 and 417:
REFERENCES AND SUGGESTED READING 40
- Page 418 and 419:
17 Properties and Effects of Natura
- Page 420 and 421:
17.3 NATURAL ROLES OF TOXINS AND VE
- Page 422 and 423:
17.4 MAJOR SITES AND MECHANISMS OF
- Page 424 and 425:
17.5 TOXINS IN UNICELLULAR ORGANISM
- Page 426 and 427:
17.6 TOXINS OF HIGHER PLANTS 417phy
- Page 428 and 429:
17.6 TOXINS OF HIGHER PLANTS 419whi
- Page 430 and 431:
17.6 TOXINS OF HIGHER PLANTS 421TAB
- Page 432 and 433:
17.7 ANIMAL VENOMS AND TOXINS 423of
- Page 434 and 435:
17.7 ANIMAL VENOMS AND TOXINS 425ac
- Page 436 and 437:
17.7 ANIMAL VENOMS AND TOXINS 427co
- Page 438 and 439:
17.7 ANIMAL VENOMS AND TOXINS 429Fi
- Page 440 and 441:
17.8 TOXIN AND VENOM THERAPY 431One
- Page 442 and 443:
REFERENCES AND SUGGESTED READING 43
- Page 444 and 445:
18 Risk AssessmentRISK ASSESSMENTRO
- Page 446 and 447:
18.1 RISK ASSESSMENT BASICS 439Step
- Page 448 and 449:
18.1 RISK ASSESSMENT BASICS 441For
- Page 450 and 451:
18.2 HAZARD IDENTIFICATION 443chemi
- Page 452 and 453:
18.3 EXPOSURE ASSESSMENT: EXPOSURE
- Page 454 and 455:
18.3 EXPOSURE ASSESSMENT: EXPOSURE
- Page 456 and 457:
18.4 DOSE-RESPONSE ASSESSMENT 449Af
- Page 458 and 459:
18.4 DOSE-RESPONSE ASSESSMENT 451me
- Page 460 and 461:
18.4 DOSE-RESPONSE ASSESSMENT 453Fi
- Page 462 and 463:
18.4 DOSE-RESPONSE ASSESSMENT 455No
- Page 464 and 465:
18.4 DOSE-RESPONSE ASSESSMENT 457Fi
- Page 466 and 467:
18.4 DOSE-RESPONSE ASSESSMENT 459Ge
- Page 468 and 469:
18.5 RISK CHARACTERIZATION 461likel
- Page 470 and 471:
18.6 PROBABILISTIC VERSUS DETERMINI
- Page 472 and 473:
18.7 EVALUATING RISK FROM CHEMICAL
- Page 474 and 475:
18.7 EVALUATING RISK FROM CHEMICAL
- Page 476 and 477:
18.8 COMPARATIVE RISK ANALYSIS 469r
- Page 478 and 479:
18.8 COMPARATIVE RISK ANALYSIS 471T
- Page 480 and 481:
18.9 RISK COMMUNICATION 473TABLE 18
- Page 482 and 483:
REFERENCES AND SUGGESTED READING 47
- Page 484 and 485:
REFERENCES AND SUGGESTED READING 47
- Page 486 and 487:
480 EXAMPLE OF RISK ASSESSMENT APPL
- Page 488 and 489:
482 EXAMPLE OF RISK ASSESSMENT APPL
- Page 490 and 491:
484 EXAMPLE OF RISK ASSESSMENT APPL
- Page 492 and 493:
486 EXAMPLE OF RISK ASSESSMENT APPL
- Page 494 and 495:
488 EXAMPLE OF RISK ASSESSMENT APPL
- Page 496 and 497:
490 EXAMPLE OF RISK ASSESSMENT APPL
- Page 498 and 499:
492 EXAMPLE OF RISK ASSESSMENT APPL
- Page 500 and 501:
494 EXAMPLE OF RISK ASSESSMENT APPL
- Page 502 and 503:
496 EXAMPLE OF RISK ASSESSMENT APPL
- Page 504 and 505:
498 EXAMPLE OF RISK ASSESSMENT APPL
- Page 506 and 507:
500 OCCUPATIONAL AND ENVIRONMENTAL
- Page 508 and 509:
502 OCCUPATIONAL AND ENVIRONMENTAL
- Page 510 and 511:
504 OCCUPATIONAL AND ENVIRONMENTAL
- Page 512 and 513:
506 OCCUPATIONAL AND ENVIRONMENTAL
- Page 514 and 515:
508 OCCUPATIONAL AND ENVIRONMENTAL
- Page 516 and 517:
21 Epidemiologic Issues inOccupatio
- Page 518 and 519:
21.3 TYPES OF EPIDEMIOLOGIC STUDIES
- Page 520 and 521:
21.5 DISEASE AND HUMAN HEALTH EFFEC
- Page 522 and 523:
21.8 MEASUREMENT OF ASSOCIATION OR
- Page 524 and 525:
21.9 BIAS 519increased or decreased
- Page 526 and 527:
REFERENCES AND SUGGESTED READING 52
- Page 528 and 529:
524 CONTROLLING OCCUPATIONAL AND EN
- Page 530 and 531:
526 CONTROLLING OCCUPATIONAL AND EN
- Page 532 and 533:
528 CONTROLLING OCCUPATIONAL AND EN
- Page 534 and 535:
530 CONTROLLING OCCUPATIONAL AND EN
- Page 536 and 537:
532 CONTROLLING OCCUPATIONAL AND EN
- Page 538 and 539:
534 CONTROLLING OCCUPATIONAL AND EN
- Page 540 and 541:
536 CONTROLLING OCCUPATIONAL AND EN
- Page 542 and 543:
538 CONTROLLING OCCUPATIONAL AND EN
- Page 544 and 545:
540 CONTROLLING OCCUPATIONAL AND EN
- Page 546 and 547:
542 CONTROLLING OCCUPATIONAL AND EN
- Page 548 and 549:
544 CONTROLLING OCCUPATIONAL AND EN
- Page 550 and 551:
546 CONTROLLING OCCUPATIONAL AND EN
- Page 552 and 553:
548 CONTROLLING OCCUPATIONAL AND EN
- Page 554 and 555:
550 CONTROLLING OCCUPATIONAL AND EN
- Page 556 and 557:
552 CONTROLLING OCCUPATIONAL AND EN
- Page 558 and 559:
554 CONTROLLING OCCUPATIONAL AND EN
- Page 560 and 561:
556 GLOSSARYaliphatic Organic compo
- Page 562 and 563:
558 GLOSSARYbenign tumor A new tiss
- Page 564 and 565:
560 GLOSSARYcytokinesis The divisio
- Page 566 and 567:
562 GLOSSARYerythropoietic stimulat
- Page 568 and 569:
564 GLOSSARYinhalation route The mo
- Page 570 and 571:
566 GLOSSARYmitochondria Small sphe
- Page 572 and 573:
568 GLOSSARYoral route The entry of
- Page 574 and 575:
570 GLOSSARYporphyrin Any of a grou
- Page 576 and 577:
572 GLOSSARYspirometry The measurem
- Page 578 and 579:
INDEXAbsorbed dose, defined, 4Absor
- Page 580 and 581:
INDEX 577Area under the tissue conc
- Page 582 and 583:
INDEX 579animal studies, 297cellula
- Page 584 and 585:
INDEX 581speciation of, 327-328Corp
- Page 586 and 587:
INDEX 583organ-specific activities,
- Page 588 and 589:
INDEX 585Follicle-stimulating hormo
- Page 590 and 591:
INDEX 587fatty liver, 120-122hepato
- Page 592 and 593:
INDEX 589Isoniazid metabolism, path
- Page 594 and 595:
INDEX 591Mechanistic toxicology, as
- Page 596 and 597:
INDEX 593Nephropathy:defined 130nep
- Page 598 and 599:
INDEX 595neurobehavioral sequelae,
- Page 600 and 601:
INDEX 597Probability density functi
- Page 602 and 603:
INDEX 599Rodenticides, 360.-361sodi
- Page 604 and 605:
INDEX 601Safe Human Dose (SHD) appr
- Page 606:
INDEX 603drug metabolism factors, 7