

Clock - Uranium Supply Crunch and Critical ... - Andrew Johns
Clock - Uranium Supply Crunch and Critical ... - Andrew Johns
Clock - Uranium Supply Crunch and Critical ... - Andrew Johns
- No tags were found...

You also want an ePaper? Increase the reach of your titles
YUMPU automatically turns print PDFs into web optimized ePapers that Google loves.
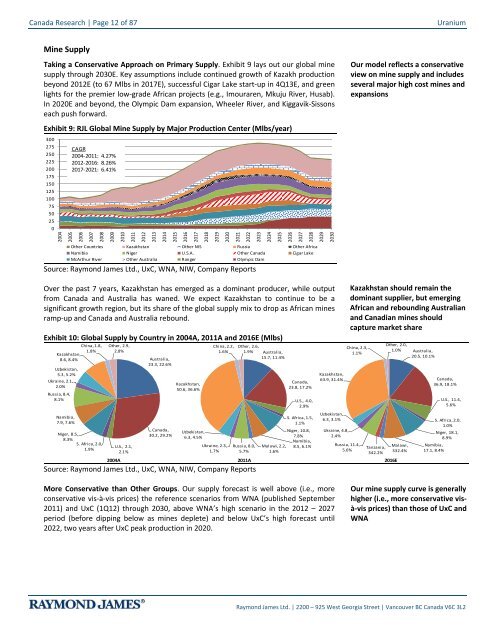
Canada Research | Page 12 of 87<strong>Uranium</strong>Mine <strong>Supply</strong>Taking a Conservative Approach on Primary <strong>Supply</strong>. Exhibit 9 lays out our global minesupply through 2030E. Key assumptions include continued growth of Kazakh productionbeyond 2012E (to 67 Mlbs in 2017E), successful Cigar Lake start-up in 4Q13E, <strong>and</strong> greenlights for the premier low-grade African projects (e.g., Imouraren, Mkuju River, Husab).In 2020E <strong>and</strong> beyond, the Olympic Dam expansion, Wheeler River, <strong>and</strong> Kiggavik-Sissonseach push forward.Exhibit 9: RJL Global Mine <strong>Supply</strong> by Major Production Center (Mlbs/year)3002752502252001751501251007550250CAGR2004-2011: 4.27%2012-2016: 8.26%2017-2021: 6.41%200420052006200720082009201020112012201320142015201620172018201920202021202220232024202520262027202820292030Other Countries Kazakhstan Other NIS Russia Other AfricaNamibia Niger U.S.A. Other Canada Cigar LakeMcArthur River Other Australia Ranger Olympic DamSource: Raymond James Ltd., UxC, WNA, NIW, Company ReportsOur model reflects a conservativeview on mine supply <strong>and</strong> includesseveral major high cost mines <strong>and</strong>expansionsOver the past 7 years, Kazakhstan has emerged as a dominant producer, while outputfrom Canada <strong>and</strong> Australia has waned. We expect Kazakhstan to continue to be asignificant growth region, but its share of the global supply mix to drop as African minesramp-up <strong>and</strong> Canada <strong>and</strong> Australia rebound.Exhibit 10: Global <strong>Supply</strong> by Country in 2004A, 2011A <strong>and</strong> 2016E (Mlbs)Kazakhstan,8.6, 8.4%Uzbekistan,5.3, 5.2%Ukraine, 2.1,2.0%Russia, 8.4,8.1%Namibia,7.9, 7.6%China, 1.8,1.8%Niger, 8.5,8.3%S. Africa, 2.0,1.9%Other, 2.9,China, 2.2, Other, 2.6,Other, 2.0,China, 2.3,2.8% 1.6% 1.9% Australia,1.0% Australia,1.1%Australia,15.7, 11.4%20.5, 10.1%23.3, 22.6%U.S., 2.1,2.1%Canada,30.2, 29.2%Kazakhstan,50.6, 36.6%Uzbekistan,6.3, 4.5%Ukraine, 2.3,1.7%Russia, 8.0,5.7%Canada,23.8, 17.2%U.S., 4.0,2.9%S. Africa, 1.5,1.1%Niger, 10.8,7.8%Namibia,Malawi, 2.2, 8.5, 6.1%1.6%Kazakhstan,63.9, 31.4%Uzbekistan,6.3, 3.1%Ukraine, 4.8,2.4%Russia, 11.4,5.6%Tanzania,342.2%2004A 2011A 2016ESource: Raymond James Ltd., UxC, WNA, NIW, Company ReportsKazakhstan should remain thedominant supplier, but emergingAfrican <strong>and</strong> rebounding Australian<strong>and</strong> Canadian mines shouldcapture market shareMalawi,332.4%Canada,36.9, 18.1%U.S., 11.4,5.6%S. Africa, 2.0,1.0%Niger, 18.1,8.9%Namibia,17.1, 8.4%More Conservative than Other Groups. Our supply forecast is well above (i.e., moreconservative vis-à-vis prices) the reference scenarios from WNA (published September2011) <strong>and</strong> UxC (1Q12) through 2030, above WNA’s high scenario in the 2012 – 2027period (before dipping below as mines deplete) <strong>and</strong> below UxC’s high forecast until2022, two years after UxC peak production in 2020.Our mine supply curve is generallyhigher (i.e., more conservative visà-visprices) than those of UxC <strong>and</strong>WNARaymond James Ltd. | 2200 – 925 West Georgia Street | Vancouver BC Canada V6C 3L2


