

Clock - Uranium Supply Crunch and Critical ... - Andrew Johns
Clock - Uranium Supply Crunch and Critical ... - Andrew Johns
Clock - Uranium Supply Crunch and Critical ... - Andrew Johns
- No tags were found...

You also want an ePaper? Increase the reach of your titles
YUMPU automatically turns print PDFs into web optimized ePapers that Google loves.
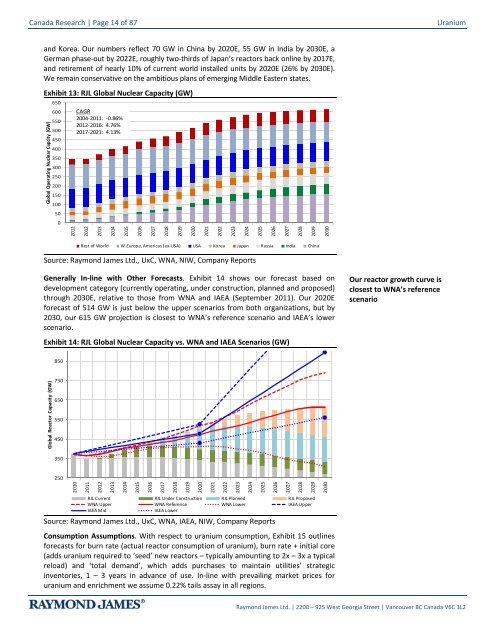
Canada Research | Page 14 of 87<strong>Uranium</strong><strong>and</strong> Korea. Our numbers reflect 70 GW in China by 2020E, 55 GW in India by 2030E, aGerman phase-out by 2022E, roughly two-thirds of Japan’s reactors back online by 2017E,<strong>and</strong> retirement of nearly 10% of current world installed units by 2020E (26% by 2030E).We remain conservative on the ambitious plans of emerging Middle Eastern states.Exhibit 13: RJL Global Nuclear Capacity (GW)Global Operating Nuclear Capcity (GW)6506005505004504003503002502001501005002011CAGR2004-2011: -0.86%2012-2016: 4.76%2017-2021: 4.13%201220132014201520162017201820192020Rest of World W.Europe, Americas (ex-USA) USA Korea Japan Russia India ChinaSource: Raymond James Ltd., UxC, WNA, NIW, Company Reports2021202220232024202520262027202820292030Generally In-line with Other Forecasts. Exhibit 14 shows our forecast based ondevelopment category (currently operating, under construction, planned <strong>and</strong> proposed)through 2030E, relative to those from WNA <strong>and</strong> IAEA (September 2011). Our 2020Eforecast of 514 GW is just below the upper scenarios from both organizations, but by2030, our 615 GW projection is closest to WNA’s reference scenario <strong>and</strong> IAEA’s lowerscenario.Exhibit 14: RJL Global Nuclear Capacity vs. WNA <strong>and</strong> IAEA Scenarios (GW)Our reactor growth curve isclosest to WNA’s referencescenario850Global Reactor Capacity (GW)75065055045035025020102011201220132014201520162017201820192020RJL Current RJL Under Construction RJL Planned RJL ProposedWNA Upper WNA Reference WNA Lower IAEA UpperIAEA MidIAEA LowerSource: Raymond James Ltd., UxC, WNA, IAEA, NIW, Company ReportsConsumption Assumptions. With respect to uranium consumption, Exhibit 15 outlinesforecasts for burn rate (actual reactor consumption of uranium), burn rate + initial core(adds uranium required to ‘seed’ new reactors – typically amounting to 2x – 3x a typicalreload) <strong>and</strong> ‘total dem<strong>and</strong>’, which adds purchases to maintain utilities’ strategicinventories, 1 – 3 years in advance of use. In-line with prevailing market prices foruranium <strong>and</strong> enrichment we assume 0.22% tails assay in all regions.2021202220232024202520262027202820292030Raymond James Ltd. | 2200 – 925 West Georgia Street | Vancouver BC Canada V6C 3L2


