

Clock - Uranium Supply Crunch and Critical ... - Andrew Johns
Clock - Uranium Supply Crunch and Critical ... - Andrew Johns
Clock - Uranium Supply Crunch and Critical ... - Andrew Johns
- No tags were found...

You also want an ePaper? Increase the reach of your titles
YUMPU automatically turns print PDFs into web optimized ePapers that Google loves.
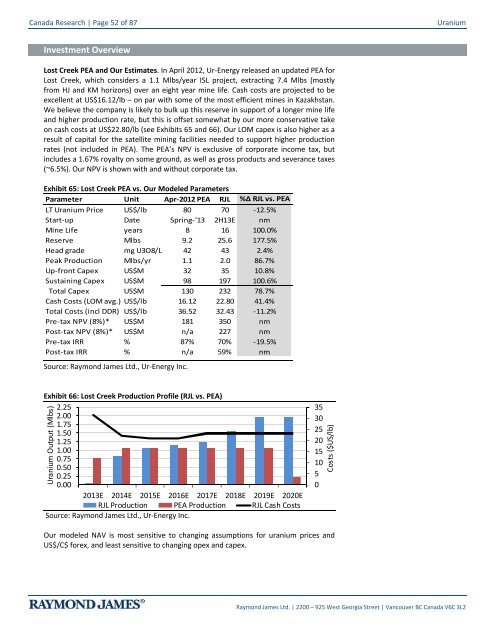
Canada Research | Page 52 of 87<strong>Uranium</strong>Investment OverviewLost Creek PEA <strong>and</strong> Our Estimates. In April 2012, Ur-Energy released an updated PEA forLost Creek, which considers a 1.1 Mlbs/year ISL project, extracting 7.4 Mlbs (mostlyfrom HJ <strong>and</strong> KM horizons) over an eight year mine life. Cash costs are projected to beexcellent at US$16.12/lb – on par with some of the most efficient mines in Kazakhstan.We believe the company is likely to bulk up this reserve in support of a longer mine life<strong>and</strong> higher production rate, but this is offset somewhat by our more conservative takeon cash costs at US$22.80/lb (see Exhibits 65 <strong>and</strong> 66). Our LOM capex is also higher as aresult of capital for the satellite mining facilities needed to support higher productionrates (not included in PEA). The PEA’s NPV is exclusive of corporate income tax, butincludes a 1.67% royalty on some ground, as well as gross products <strong>and</strong> severance taxes(~6.5%). Our NPV is shown with <strong>and</strong> without corporate tax.Exhibit 65: Lost Creek PEA vs. Our Modeled ParametersParameter Unit Apr-2012 PEA RJL %Δ RJL vs. PEALT <strong>Uranium</strong> Price US$/lb 80 70 -12.5%Start-up Date Spring-'13 2H13E nmMine Life years 8 16 100.0%Reserve Mlbs 9.2 25.6 177.5%Head grade mg U3O8/L 42 43 2.4%Peak Production Mlbs/yr 1.1 2.0 86.7%Up-front Capex US$M 32 35 10.8%Sustaining Capex US$M 98 197 100.6%Total Capex US$M 130 232 78.7%Cash Costs (LOM avg.) US$/lb 16.12 22.80 41.4%Total Costs (incl DDR) US$/lb 36.52 32.43 -11.2%Pre-tax NPV (8%)* US$M 181 350 nmPost-tax NPV (8%)* US$M n/a 227 nmPre-tax IRR % 87% 70% -19.5%Post-tax IRR % n/a 59% nmSource: Raymond James Ltd., Ur-Energy Inc.Exhibit 66: Lost Creek Production Profile (RJL vs. PEA)2.252.001.751.501.251.000.750.500.250.002013E 2014E 2015E 2016E 2017E 2018E 2019E 2020ERJL Production PEA Production RJL Cash CostsSource: Raymond James Ltd., Ur-Energy Inc.<strong>Uranium</strong> Output (Mlbs)35302520151050Costs ($US/lb)Our modeled NAV is most sensitive to changing assumptions for uranium prices <strong>and</strong>US$/C$ forex, <strong>and</strong> least sensitive to changing opex <strong>and</strong> capex.Raymond James Ltd. | 2200 – 925 West Georgia Street | Vancouver BC Canada V6C 3L2


