

Clock - Uranium Supply Crunch and Critical ... - Andrew Johns
Clock - Uranium Supply Crunch and Critical ... - Andrew Johns
Clock - Uranium Supply Crunch and Critical ... - Andrew Johns
- No tags were found...

Create successful ePaper yourself
Turn your PDF publications into a flip-book with our unique Google optimized e-Paper software.
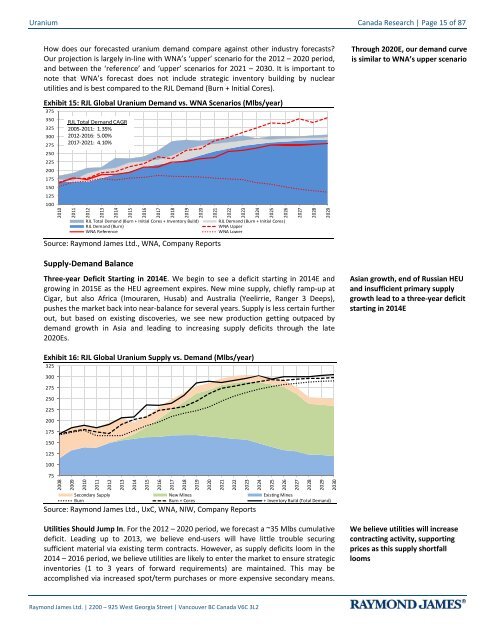
<strong>Uranium</strong> Canada Research | Page 15 of 87How does our forecasted uranium dem<strong>and</strong> compare against other industry forecasts?Our projection is largely in-line with WNA’s ‘upper’ scenario for the 2012 – 2020 period,<strong>and</strong> between the ‘reference’ <strong>and</strong> ‘upper’ scenarios for 2021 – 2030. It is important tonote that WNA’s forecast does not include strategic inventory building by nuclearutilities <strong>and</strong> is best compared to the RJL Dem<strong>and</strong> (Burn + Initial Cores).Exhibit 15: RJL Global <strong>Uranium</strong> Dem<strong>and</strong> vs. WNA Scenarios (Mlbs/year)3753503253002752502252001751501251002010RJL Total Dem<strong>and</strong> CAGR2005-2011: 1.35%2012-2016: 5.00%2017-2021: 4.10%201120122013201420152016201720182019RJL Total Dem<strong>and</strong> (Burn + Initial Cores + Inventory Build)RJL Dem<strong>and</strong> (Burn)WNA ReferenceSource: Raymond James Ltd., WNA, Company Reports<strong>Supply</strong>-Dem<strong>and</strong> Balance2020202120222023202420252026RJL Dem<strong>and</strong> (Burn + Initial Cores)WNA UpperWNA LowerThree-year Deficit Starting in 2014E. We begin to see a deficit starting in 2014E <strong>and</strong>growing in 2015E as the HEU agreement expires. New mine supply, chiefly ramp-up atCigar, but also Africa (Imouraren, Husab) <strong>and</strong> Australia (Yeelirrie, Ranger 3 Deeps),pushes the market back into near-balance for several years. <strong>Supply</strong> is less certain furtherout, but based on existing discoveries, we see new production getting outpaced bydem<strong>and</strong> growth in Asia <strong>and</strong> leading to increasing supply deficits through the late2020Es.202720282029Through 2020E, our dem<strong>and</strong> curveis similar to WNA’s upper scenarioAsian growth, end of Russian HEU<strong>and</strong> insufficient primary supplygrowth lead to a three-year deficitstarting in 2014EExhibit 16: RJL Global <strong>Uranium</strong> <strong>Supply</strong> vs. Dem<strong>and</strong> (Mlbs/year)3253002752502252001751501251007520082009201020112012201320142015201620172018Secondary <strong>Supply</strong> New Mines Existing MinesBurn Burn + Cores + Inventory Build (Total Dem<strong>and</strong>)Source: Raymond James Ltd., UxC, WNA, NIW, Company Reports201920202021202220232024202520262027202820292030Utilities Should Jump In. For the 2012 – 2020 period, we forecast a ~35 Mlbs cumulativedeficit. Leading up to 2013, we believe end-users will have little trouble securingsufficient material via existing term contracts. However, as supply deficits loom in the2014 – 2016 period, we believe utilities are likely to enter the market to ensure strategicinventories (1 to 3 years of forward requirements) are maintained. This may beaccomplished via increased spot/term purchases or more expensive secondary means.We believe utilities will increasecontracting activity, supportingprices as this supply shortfallloomsRaymond James Ltd. | 2200 – 925 West Georgia Street | Vancouver BC Canada V6C 3L2


