

Clock - Uranium Supply Crunch and Critical ... - Andrew Johns
Clock - Uranium Supply Crunch and Critical ... - Andrew Johns
Clock - Uranium Supply Crunch and Critical ... - Andrew Johns
- No tags were found...

You also want an ePaper? Increase the reach of your titles
YUMPU automatically turns print PDFs into web optimized ePapers that Google loves.
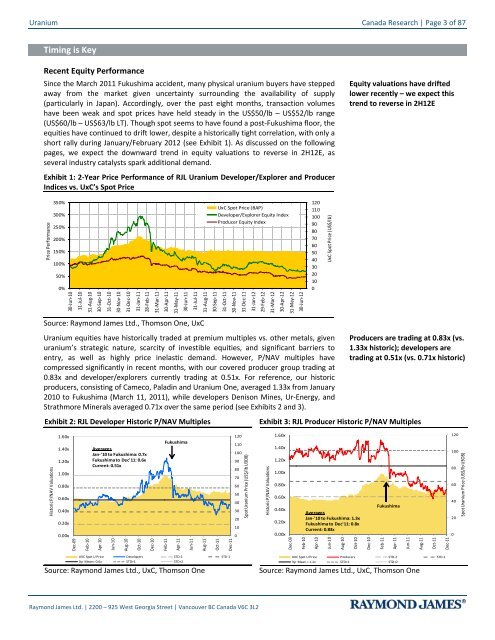
<strong>Uranium</strong> Canada Research | Page 3 of 87Timing is KeyRecent Equity PerformanceSince the March 2011 Fukushima accident, many physical uranium buyers have steppedaway from the market given uncertainty surrounding the availability of supply(particularly in Japan). Accordingly, over the past eight months, transaction volumeshave been weak <strong>and</strong> spot prices have held steady in the US$50/lb – US$52/lb range(US$60/lb – US$63/lb LT). Though spot seems to have found a post-Fukushima floor, theequities have continued to drift lower, despite a historically tight correlation, with only ashort rally during January/February 2012 (see Exhibit 1). As discussed on the followingpages, we expect the downward trend in equity valuations to reverse in 2H12E, asseveral industry catalysts spark additional dem<strong>and</strong>.Exhibit 1: 2-Year Price Performance of RJL <strong>Uranium</strong> Developer/Explorer <strong>and</strong> ProducerIndices vs. UxC’s Spot PriceEquity valuations have driftedlower recently – we expect thistrend to reverse in 2H12EPrice Performance350%300%250%200%150%100%50%0%UxC Spot Price (BAP)Developer/Explorer Equity IndexProducer Equity Index120110100908070605040302010030-Jun-1031-Jul-1031-Aug-1030-Sep-1031-Oct-1030-Nov-1031-Dec-1031-Jan-1128-Feb-1131-Mar-1130-Apr-1131-May-1130-Jun-1131-Jul-11UxC Spot Price (US$/lb)31-Aug-1130-Sep-1131-Oct-1130-Nov-1131-Dec-1131-Jan-1229-Feb-1231-Mar-1230-Apr-1231-May-1230-Jun-12Source: Raymond James Ltd., Thomson One, UxC<strong>Uranium</strong> equities have historically traded at premium multiples vs. other metals, givenuranium’s strategic nature, scarcity of investible equities, <strong>and</strong> significant barriers toentry, as well as highly price inelastic dem<strong>and</strong>. However, P/NAV multiples havecompressed significantly in recent months, with our covered producer group trading at0.83x <strong>and</strong> developer/explorers currently trading at 0.51x. For reference, our historicproducers, consisting of Cameco, Paladin <strong>and</strong> <strong>Uranium</strong> One, averaged 1.33x from January2010 to Fukushima (March 11, 2011), while developers Denison Mines, Ur-Energy, <strong>and</strong>Strathmore Minerals averaged 0.71x over the same period (see Exhibits 2 <strong>and</strong> 3).Exhibit 2: RJL Developer Historic P/NAV MultiplesProducers are trading at 0.83x (vs.1.33x historic); developers aretrading at 0.51x (vs. 0.71x historic)Exhibit 3: RJL Producer Historic P/NAV MultiplesHistoric P/NAV Valuations1.60x1.40x1.20x1.00x0.80x0.60x0.40x0.20x0.00xDec-09Feb-10AveragesJan-'10 to Fukushima: 0.7xFukushima to Dec'11: 0.6xCurrent: 0.51xApr-10Jun-10Aug-10Oct-10Dec-10FukushimaFeb-11Apr-11Jun-11Aug-11Oct-11Dec-111201101009080706050403020100Spot <strong>Uranium</strong> Price (US$/lb U3O8)Historic P/NAV Valuations1.60x1.40x1.20x1.00x0.80x0.60x0.40x0.20x0.00xDec-09Feb-10AveragesJan-'10 to Fukushima: 1.3xFukushima to Dec'11: 0.8xCurrent: 0.83xApr-10Jun-10Aug-10Oct-10Dec-10FukushimaFeb-11Apr-11Jun-11Aug-11Oct-11Dec-11120100806040200Spot <strong>Uranium</strong> Price (US$/lb U3O8)UXC Spot U Price Developers STD-2 STD-13yr Mean= 0.6x STD+1 STD+2UXC Spot U Price Producers STD-2 STD-13yr Mean = 1.1x STD+1 STD+2Source: Raymond James Ltd., UxC, Thomson One Source: Raymond James Ltd., UxC, Thomson OneRaymond James Ltd. | 2200 – 925 West Georgia Street | Vancouver BC Canada V6C 3L2


