

Clock - Uranium Supply Crunch and Critical ... - Andrew Johns
Clock - Uranium Supply Crunch and Critical ... - Andrew Johns
Clock - Uranium Supply Crunch and Critical ... - Andrew Johns
- No tags were found...

Create successful ePaper yourself
Turn your PDF publications into a flip-book with our unique Google optimized e-Paper software.
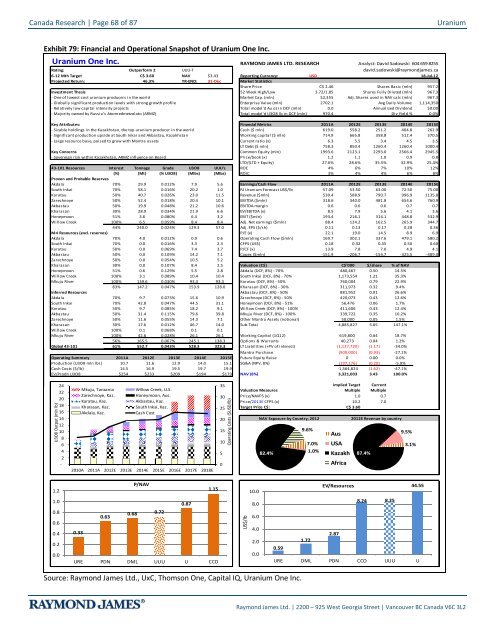
Canada Research | Page 68 of 87<strong>Uranium</strong>Exhibit 79: Financial <strong>and</strong> Operational Snapshot of <strong>Uranium</strong> One Inc.<strong>Uranium</strong> One Inc.RAYMOND JAMES LTD. RESEARCH Analyst: David Sadowski 604 659 8255Rating: Outperform 2 UUU-T david.sadowski@raymondjames.ca6-12 Mth Target C$ 3.60 NAV $3.43 Reporting Currency: USD 18-Jul-12Projected Return: 46.3% YR-END: 31-Dec Market StatisticsShare Price C$ 2.46 Shares Basic (mln) 957.2Investment Thesis 52 Week High/Low 3.72/1.85 Shares Fully Diluted (mln) 967.3- One of lowest cost uranium producers in the world Market Cap. (mln) $2,355 Adj. Shares used in NAV calc (mln) 967.3- Globally significant production levels with strong growth profile Enterprise Value (mln) 2702.1 Avg Daily Volume: 1,114,350- Relatively low capital intensity projects Total model'd Au oz in DCF (mln) 0.0 Annualized Dividend $0.00- Majority owned by Russia's Atomredmetzoloto (ARMZ) Total model'd U3O8 lb in DCF (mln) 970.4 Div Yield % 0.0%Key Attributes: Financial Metrics 2011A 2012E 2013E 2014E 2015E- Sizable holdings in the Kazakhstan, the top uranium producer in the world Cash ($ mln) 619.0 558.2 251.2 404.8 262.9- Significant production upside at South Inkai <strong>and</strong> Akbastau, Kazakhstan Working capital ($ mln) 714.9 665.8 358.8 512.4 370.5- Large resource base, poised to grow with Mantra assets Current ratio (x) 6.3 5.5 3.4 4.5 3.5LT Debt ($ mln) 758.3 850.4 1260.4 1260.4 1000.4Key Concerns Common Equity (mln) 1993.6 2123.1 2293.0 2566.4 2945.5- Sovereign risk within Kazakhstan, ARMZ influence on Board Price/book (x) 1.2 1.1 1.0 0.9 0.8LTD/(LTD + Equity) 27.6% 28.6% 35.5% 32.9% 25.4%43-101 Resources Interest Tonnage Grade U3O8 UUU's ROE 4% 6% 7% 10% 12%(%) (Mt) (% U3O8) (Mlbs) (Mlbs) ROIC 3% 4% 4% 6% 8%Proven <strong>and</strong> Probable ReservesAkdala 70% 29.9 0.012% 7.9 5.6 Earnings/Cash Flow 2011A 2012E 2013E 2014E 2015ESouth Inkai 70% 58.1 0.016% 20.2 1.0 RJ <strong>Uranium</strong> Forecast US$/lb 57.09 53.50 63.00 72.50 75.00Karatau 50% 40.7 0.026% 23.0 11.5 Revenue ($mln) 530.4 588.9 790.7 996.9 1135.8Zarechnoye 50% 52.4 0.018% 20.4 10.1 EBITDA ($mln) 318.6 340.0 481.8 654.6 760.9Akbastau 50% 19.9 0.048% 21.2 10.6 EBITDA margin 0.6 0.6 0.6 0.7 0.7Kharasan 30% 28.9 0.034% 21.9 6.6 EV/EBITDA (x) 8.5 7.9 5.6 4.1 3.6Honeymoon 51% 3.6 0.080% 6.4 3.2 EBIT ($mln) 193.4 216.1 314.1 448.8 532.9Willow Creek 100% 6.5 0.059% 8.4 8.4 Adj. Net earnings ($mln) 88.4 124.2 162.5 265.9 344.744% 240.0 0.024% 129.3 57.0 Adj. EPS ($/sh) 0.11 0.13 0.17 0.28 0.36M+I Resources (excl. reserves) P/E (x) 22.1 19.0 14.5 8.9 6.9Akdala 70% 4.0 0.012% 0.9 0.6 Operating Cash Flow ($mln) 169.7 302.1 337.6 479.1 580.2South Inkai 70% 0.0 0.016% 3.3 2.3 CFPS (US$) 0.18 0.32 0.35 0.50 0.60Karatau 50% 0.0 0.069% 7.4 3.7 P/CF (x) 13.9 7.8 7.0 4.9 4.1Akbastau 50% 0.0 0.109% 14.2 7.1 Capex ($mln) -151.9 -206.7 -154.7 -325.5 -489.0Zarechnoye 50% 0.0 0.054% 10.5 5.2Kharasan 30% 0.0 0.107% 8.4 2.5 Valuation (C$) C$'000 $/share % of NAVHoneymoon 51% 0.6 0.129% 5.5 2.8 Akdala (DCF, 8%) - 70% 480,467 0.50 14.5%Willow Creek 100% 3.1 0.089% 10.4 10.4 South Inkai (DCF, 8%) - 70% 1,173,554 1.21 35.3%Mkuju River 100% 139.6 0.030% 93.3 93.3 Karatau (DCF, 8%) - 50% 760,004 0.79 22.9%83% 147.2 0.047% 153.9 128.0 Kharasan (DCF, 8%) - 30% 311,973 0.32 9.4%Inferred Resources Akbastau (DCF, 8%) - 50% 881,952 0.91 26.6%Akdala 70% 9.7 0.073% 15.6 10.9 Zarechnoye (DCF, 8%) - 50% 420,073 0.43 12.6%South Inkai 70% 42.8 0.047% 44.5 31.1 Honeymoon (DCF, 8%) - 51% 56,476 0.06 1.7%Karatau 50% 9.7 0.085% 18.2 9.1 Willow Creek (DCF, 8%) - 100% 411,606 0.43 12.4%Akbastau 50% 31.4 0.115% 79.6 39.8 Mkuju River (DCF, 8%) - 100% 339,722 0.35 10.2%Zarechnoye 50% 11.6 0.055% 14.3 7.1 Other Mantra Assets (notional) 50,000 0.05 1.5%Kharasan 30% 17.6 0.012% 46.7 14.0 Sub-Total 4,885,827 5.05 147.1%Willow Creek 100% 0.1 0.068% 0.1 0.1Mkuju River 100% 42.6 0.028% 26.1 26.1 Working Capital (1Q12) 619,800 0.64 18.7%56% 165.5 0.067% 245.1 138.3 Options & Warrants 40,273 0.04 1.2%Global 43-101 61% 552.7 0.043% 528.3 323.3 LT Liabilities (+PV of interest) (1,127,720) (1.17) -34.0%Mantra Purchase (900,000) (0.93) -27.1%Operating Summary 2011A 2012E 2013E 2014E 2015E Future Equity Raise 0 0.00 0.0%Production (U3O8 mln lbs) 10.7 11.6 12.9 14.0 15.1 SG&A (NPV, 8%) (197,176) (0.20) -5.9%Cash Costs ($/lb) 14.5 16.9 19.5 19.7 19.9 -1,564,824 (1.62) -47.1%EV/Prodn U3O8 $254 $233 $209 $194 $179 NAV (8%) 3,321,003 3.43 100.0%U3O8 Output (mln lb)24222018161412108642-Mkuju, Tanzania Willow Creek, U.S.Zarechnoye, Kaz. Honeymoon, Aus.Karatau, Kaz.Akbastau, Kaz.Kharasan, Kaz.South Inkai, Kaz.Akdala, Kaz.Cash Cost2010A 2011A 2012E 2013E 2014E 2015E 2016E 2017E 2018E35302520151050Operating Costs ($USD/lb)Implied Target CurrentValuation Measures Multiple MultiplePrice/NAVPS (x) 1.0 0.7Price/2013E CFPS (x) 10.2 7.0Target Price C$: C$ 3.60NAV Exposure by Country, 201282.4%9.6%7.0%1.0%AusUSAKazakhAfrica2012E Revenue by country87.4%9.5%3.1%1.2P/NAV1.1510.0EV/Resources44.551.00.80.60.40.20.00.870.630.68 0.720.33URE PDN DML UUU U CCOUS$/lb8.06.04.02.00.08.24 8.252.871.720.59URE DML PDN CCO UUU USource: Raymond James Ltd., UxC, Thomson One, Capital IQ, <strong>Uranium</strong> One Inc.Raymond James Ltd. | 2200 – 925 West Georgia Street | Vancouver BC Canada V6C 3L2


