

Clock - Uranium Supply Crunch and Critical ... - Andrew Johns
Clock - Uranium Supply Crunch and Critical ... - Andrew Johns
Clock - Uranium Supply Crunch and Critical ... - Andrew Johns
- No tags were found...

You also want an ePaper? Increase the reach of your titles
YUMPU automatically turns print PDFs into web optimized ePapers that Google loves.
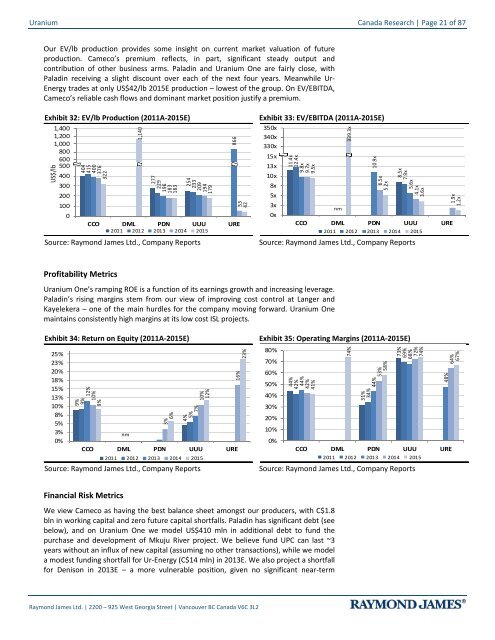
<strong>Uranium</strong> Canada Research | Page 21 of 87Our EV/lb production provides some insight on current market valuation of futureproduction. Cameco’s premium reflects, in part, significant steady output <strong>and</strong>contribution of other business arms. Paladin <strong>and</strong> <strong>Uranium</strong> One are fairly close, withPaladin receiving a slight discount over each of the next four years. Meanwhile Ur-Energy trades at only US$42/lb 2015E production – lowest of the group. On EV/EBITDA,Cameco’s reliable cash flows <strong>and</strong> dominant market position justify a premium.Exhibit 32: EV/lb Production (2011A-2015E)1,4001,2001,000800600500 400400US$/lb30020010001,140EV/lb production('11-'15)404415400376322277229196183183254233209194179866CCO DML PDN UUU URE2011 2012 2013 2014 2015Source: Raymond James Ltd., Company Reports5342Exhibit 33: EV/EBITDA (2011A-2015E)350x340x330x320x 15x310x 13x300x 10x8x5x3x0x11.4x12.4x9.8x9.7x9.5xEV/EBITDA('11-'15)nm339.3x10.9x6.5x5.2x8.5x7.9x5.6x4.1x3.6xCCO DML PDN UUU URE2011 2012 2013 2014 2015Source: Raymond James Ltd., Company Reports1.9x1.2xProfitability Metrics<strong>Uranium</strong> One’s ramping ROE is a function of its earnings growth <strong>and</strong> increasing leverage.Paladin’s rising margins stem from our view of improving cost control at Langer <strong>and</strong>Kayelekera – one of the main hurdles for the company moving forward. <strong>Uranium</strong> Onemaintains consistently high margins at its low cost ISL projects.Exhibit 34: Return on Equity (2011A-2015E)25%23%20%18%15%13%10%8%5%3%0%9%9%ROE('11-'15)12%10%9%nm3%6%4%5%7%10%12%CCO DML PDN UUU URE2011 2012 2013 2014 2015Source: Raymond James Ltd., Company Reports16%23%Exhibit 35: Operating Margins (2011A-2015E)80%70%60%50%Operating Margins40%('11-'15)30%20%to add10%0%CCO DML PDN UUU URE2011 2012 2013 2014 2015Source: Raymond James Ltd., Company Reports44%42%44%42%41%74%73%69%68%72%74%31%34%44%53%58%48%64%67%Financial Risk MetricsWe view Cameco as having the best balance sheet amongst our producers, with C$1.8bln in working capital <strong>and</strong> zero future capital shortfalls. Paladin has significant debt (seebelow), <strong>and</strong> on <strong>Uranium</strong> One we model US$410 mln in additional debt to fund thepurchase <strong>and</strong> development of Mkuju River project. We believe fund UPC can last ~3years without an influx of new capital (assuming no other transactions), while we modela modest funding shortfall for Ur-Energy (C$14 mln) in 2013E. We also project a shortfallfor Denison in 2013E – a more vulnerable position, given no significant near-termRaymond James Ltd. | 2200 – 925 West Georgia Street | Vancouver BC Canada V6C 3L2


