

Clock - Uranium Supply Crunch and Critical ... - Andrew Johns
Clock - Uranium Supply Crunch and Critical ... - Andrew Johns
Clock - Uranium Supply Crunch and Critical ... - Andrew Johns
- No tags were found...

You also want an ePaper? Increase the reach of your titles
YUMPU automatically turns print PDFs into web optimized ePapers that Google loves.
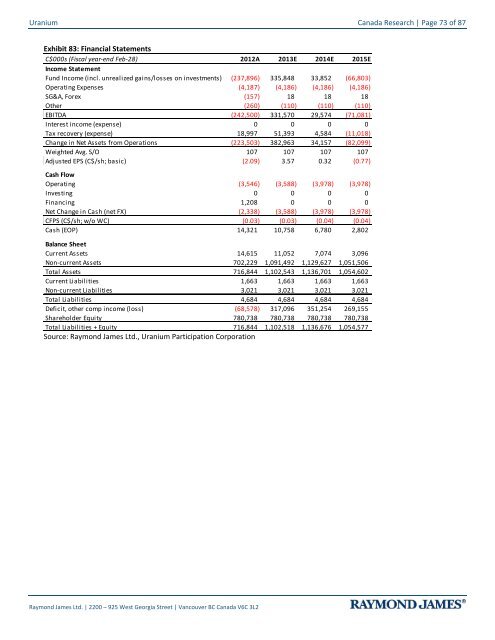
<strong>Uranium</strong> Canada Research | Page 73 of 87Exhibit 83: Financial StatementsC$000s (Fiscal year-end Feb-28) 2012A 2013E 2014E 2015EIncome StatementFund Income (incl. unrealized gains/losses on investments) (237,896) 335,848 33,852 (66,803)Operating Expenses (4,187) (4,186) (4,186) (4,186)SG&A, Forex (157) 18 18 18Other (260) (110) (110) (110)EBITDA (242,500) 331,570 29,574 (71,081)Interest income (expense) 0 0 0 0Tax recovery (expense) 18,997 51,393 4,584 (11,018)Change in Net Assets from Operations (223,503) 382,963 34,157 (82,099)Weighted Avg. S/O 107 107 107 107Adjusted EPS (C$/sh; basic) (2.09) 3.57 0.32 (0.77)Cash FlowOperating (3,546) (3,588) (3,978) (3,978)Investing 0 0 0 0Financing 1,208 0 0 0Net Change in Cash (net FX) (2,338) (3,588) (3,978) (3,978)CFPS (C$/sh; w/o WC) (0.03) (0.03) (0.04) (0.04)Cash (EOP) 14,321 10,758 6,780 2,802Balance SheetCurrent Assets 14,615 11,052 7,074 3,096Non-current Assets 702,229 1,091,492 1,129,627 1,051,506Total Assets 716,844 1,102,543 1,136,701 1,054,602Current Liabilities 1,663 1,663 1,663 1,663Non-current Liabilities 3,021 3,021 3,021 3,021Total Liabilities 4,684 4,684 4,684 4,684Deficit, other comp income (loss) (68,578) 317,096 351,254 269,155Shareholder Equity 780,738 780,738 780,738 780,738Total Liabilities + Equity 716,844 1,102,518 1,136,676Source: Raymond James Ltd., <strong>Uranium</strong> Participation Corporation1,054,577Raymond James Ltd. | 2200 – 925 West Georgia Street | Vancouver BC Canada V6C 3L2


