

Clock - Uranium Supply Crunch and Critical ... - Andrew Johns
Clock - Uranium Supply Crunch and Critical ... - Andrew Johns
Clock - Uranium Supply Crunch and Critical ... - Andrew Johns
- No tags were found...

You also want an ePaper? Increase the reach of your titles
YUMPU automatically turns print PDFs into web optimized ePapers that Google loves.
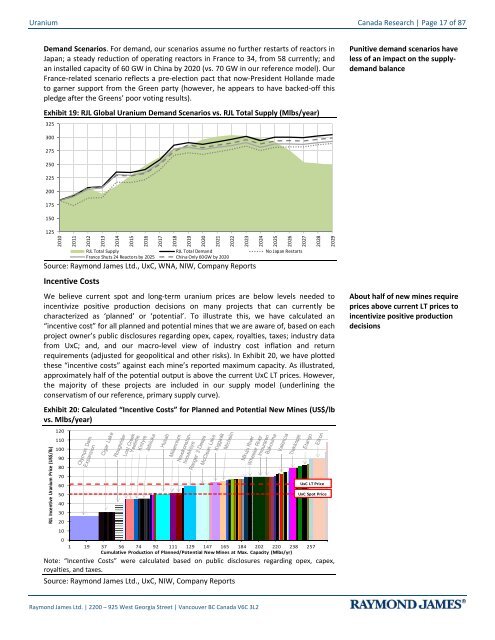
<strong>Uranium</strong> Canada Research | Page 17 of 87Dem<strong>and</strong> Scenarios. For dem<strong>and</strong>, our scenarios assume no further restarts of reactors inJapan; a steady reduction of operating reactors in France to 34, from 58 currently; <strong>and</strong>an installed capacity of 60 GW in China by 2020 (vs. 70 GW in our reference model). OurFrance-related scenario reflects a pre-election pact that now-President Holl<strong>and</strong>e madeto garner support from the Green party (however, he appears to have backed-off thispledge after the Greens’ poor voting results).Exhibit 19: RJL Global <strong>Uranium</strong> Dem<strong>and</strong> Scenarios vs. RJL Total <strong>Supply</strong> (Mlbs/year)325Punitive dem<strong>and</strong> scenarios haveless of an impact on the supplydem<strong>and</strong>balance3002752502252001751501252010201120122013201420152016201720182019RJL Total <strong>Supply</strong> RJL Total Dem<strong>and</strong> No Japan RestartsFrance Shuts 24 Reactors by 2025 China Only 60GW by 2020Source: Raymond James Ltd., UxC, WNA, NIW, Company ReportsIncentive CostsWe believe current spot <strong>and</strong> long-term uranium prices are below levels needed toincentivize positive production decisions on many projects that can currently becharacterized as ‘planned’ or ‘potential’. To illustrate this, we have calculated an“incentive cost” for all planned <strong>and</strong> potential mines that we are aware of, based on eachproject owner’s public disclosures regarding opex, capex, royalties, taxes; industry datafrom UxC; <strong>and</strong>, <strong>and</strong> our macro-level view of industry cost inflation <strong>and</strong> returnrequirements (adjusted for geopolitical <strong>and</strong> other risks). In Exhibit 20, we have plottedthese “incentive costs” against each mine’s reported maximum capacity. As illustrated,approximately half of the potential output is above the current UxC LT prices. However,the majority of these projects are included in our supply model (underlining theconservatism of our reference, primary supply curve).Exhibit 20: Calculated “Incentive Costs” for Planned <strong>and</strong> Potential New Mines (US$/lbvs. Mlbs/year)RJL Incentive <strong>Uranium</strong> Price (US$/lb)12011010090807060UxC LT Price50UxC Spot Price4030201001 19 37 56 74 92 111 129 147 165 184 202 220 238 257Cumulative Production of Planned/Potential New Mines at Max. Capacity (Mlbs/yr)Note: “Incentive Costs” were calculated based on public disclosures regarding opex, capex,royalties, <strong>and</strong> taxes.Source: Raymond James Ltd., UxC, NIW, Company Reports2020202120222023202420252026202720282029About half of new mines requireprices above current LT prices toincentivize positive productiondecisionsRaymond James Ltd. | 2200 – 925 West Georgia Street | Vancouver BC Canada V6C 3L2


