

Clock - Uranium Supply Crunch and Critical ... - Andrew Johns
Clock - Uranium Supply Crunch and Critical ... - Andrew Johns
Clock - Uranium Supply Crunch and Critical ... - Andrew Johns
- No tags were found...

Create successful ePaper yourself
Turn your PDF publications into a flip-book with our unique Google optimized e-Paper software.
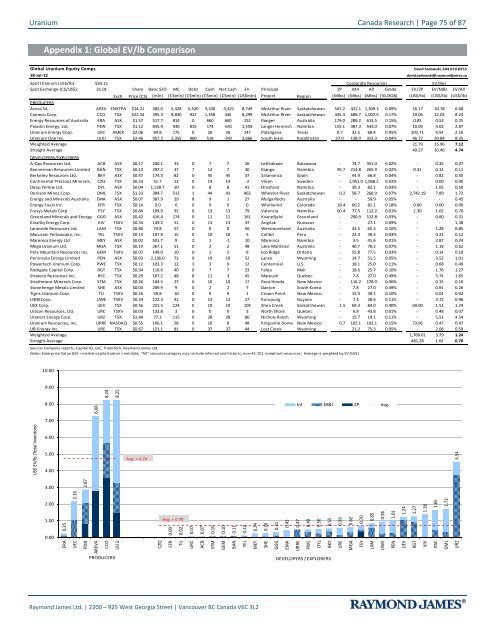
<strong>Uranium</strong> Canada Research | Page 75 of 87Appendix 1: Global EV/lb ComparisonGlobal <strong>Uranium</strong> Equity Comps David Sadowski, 604.659.825518-Jul-12david.sadowski@raymondjames.caSpot <strong>Uranium</strong> (US$/lb): $50.15 Corporate ResourcesEV/ResSpot Exchange (C$/US$): $1.01 Share Basic S/O MC Debt Cash Net Cash EV Principal 2P M+I All Grade EV/2P EV/M&I EV/AllSpot Exchange (C$/A$) $1.05 Exch. Price (C$) (mln) (C$mln) (C$mln) (C$mln) (C$mln) (US$mln) Project Region (Mlbs) (Mlbs) (Mlbs) (%U3O8) (US$/lb) (US$/lb) (US$/lb)PRODUCERSAreva SA AREV ENXTPA $14.21 382.0 5,428 6,520 3,100 -3,421 8,749 McArthur River Saskatchewan 541.2 421.1 1,309.3 0.09% 16.17 20.78 6.68Cameco Corp. CCO TSX $22.34 395.3 8,830 922 1,358 436 8,299 McArthur River Saskatchewan 435.4 689.7 1,007.5 0.17% 19.06 12.03 8.24Energy Resources of Australia ERA ASX $1.57 517.7 814 0 660 660 152 Ranger Australia 179.0 289.2 613.5 0.15% 0.85 0.53 0.25Paladin Energy, Ltd. PDN TSX $1.12 835.4 936 815 174 -641 1,559 Langer Heinrich Namibia 155.1 387.3 543.0 0.07% 10.05 4.02 2.87<strong>Uranium</strong> Energy Corp. UEC AMEX $2.06 84.8 175 0 26 26 147 Palangana Texas 0.7 32.5 68.4 0.05% 202.71 4.54 2.16<strong>Uranium</strong> One Inc. UUU TSX $2.46 957.2 2,355 860 518 -342 2,666 South Inkai Kazakhstan 57.0 128.0 323.3 0.04% 46.77 20.84 8.25Weighted Average Avg. 8.3 21.79 15.96 7.12Straight Average 49.27 10.46 4.74DEVELOPERS/EXPLORERSA-Cap Resources Ltd. ACB ASX $0.17 200.1 33 0 7 7 26 Letlhakane Botswana - 74.7 351.0 0.02% - 0.35 0.07Bannerman Resources Limited BAN TSX $0.13 297.2 37 7 14 7 30 Etango Namibia 95.7 214.8 265.9 0.02% 0.31 0.14 0.11Berkeley Resources Ltd. BKY ASX $0.47 174.3 82 0 45 45 37 Salamanca Spain - 44.9 66.8 0.04% - 0.82 0.55Continental Precious Minerals, CZQ TSX $0.23 51.7 12 0 14 14 -2 Viken Sweden - 1,051.0 1,068.2 0.02% - 0.00 0.00Deep Yellow Ltd. DYL ASX $0.04 1,128.7 50 0 8 8 41 Omahola Namibia - 39.3 82.1 0.03% - 1.05 0.50Denison Mines Corp. DML TSX $1.33 384.7 512 1 44 43 463 Wheeler River Saskatchewan 0.2 58.7 268.9 0.07% 2,742.19 7.89 1.72Energy <strong>and</strong> Minerals Australia EMA ASX $0.07 387.9 29 8 9 1 27 Mulga Rocks Australia - - 59.9 0.05% - - 0.45Energy Fuels Inc. EFR TSX $0.14 0.0 0 0 0 0 0 Whirlwind Colorado 18.4 60.2 81.1 0.18% 0.00 0.00 0.00Forsys Metals Corp. FSY TSX $0.84 109.9 92 0 13 13 79 Valencia Namibia 60.4 77.5 112.2 0.01% 1.30 1.02 0.70Greenl<strong>and</strong> Minerals <strong>and</strong> Energy GGG ASX $0.42 416.4 174 0 11 11 161 Kvanefjeld Greenl<strong>and</strong> - 200.9 512.8 0.03% - 0.80 0.31Kivalliq Energy Corp. KIV TSXV $0.34 149.2 51 0 13 13 37 Angilak Nunavut - - 27.1 0.69% - - 1.38Laramide Resources Ltd. LAM TSX $0.80 70.8 57 0 0 0 56 Westmorel<strong>and</strong> Australia - 43.5 65.3 0.10% - 1.28 0.85Macusani Yellowcake, Inc. YEL TSXV $0.14 107.8 15 0 10 10 5 Colibri Peru - 22.3 39.4 0.03% - 0.21 0.12Marenica Energy Ltd MEY ASX $0.02 501.7 9 2 1 -1 10 Marenica Namibia - 3.5 41.6 0.01% - 2.87 0.24Mega <strong>Uranium</strong> Ltd. MGA TSX $0.19 267.1 51 0 2 2 48 Lake Maitl<strong>and</strong> Australia - 40.7 78.2 0.07% - 1.18 0.62Pele Mountain Resources Inc. GEM TSXV $0.07 149.0 10 0 2 2 8 Eco Ridge Ontario - 55.8 77.5 0.03% - 0.14 0.10Peninsula Energy Limited PEN ASX $0.03 2,136.0 71 0 19 19 52 Lance Wyoming - 14.7 51.5 0.05% - 3.52 1.01Powertech <strong>Uranium</strong> Corp. PWE TSX $0.12 103.3 12 3 3 0 12 Centennial U.S. - 18.1 25.0 0.11% - 0.68 0.49Rockgate Capital Corp. RGT TSX $0.34 116.6 40 0 7 7 33 Falea Mali - 18.6 25.7 0.10% - 1.76 1.27Strateco Resources Inc. RSC TSX $0.29 167.2 48 8 11 3 45 Matoush Quebec - 7.8 27.0 0.49% - 5.74 1.65Strathmore Minerals Corp. STM TSX $0.26 104.5 27 0 10 10 17 Roca Honda New Mexico - 116.2 178.0 0.06% - 0.15 0.10Stonehenge Metals Limited SHE ASX $0.03 289.9 9 0 2 2 7 Daejon South Korea - 7.8 27.0 0.49% - 0.91 0.26Tigris <strong>Uranium</strong> Corp. TU TSXV $0.16 59.8 10 0 9 9 1 Crown Point New Mexico - 15.0 39.1 0.10% - 0.04 0.02U308 Corp. UWE TSXV $0.34 122.4 41 0 13 13 27 Kurupung Guyana - 7.4 28.6 0.11% - 3.72 0.96UEX Corp. UEX TSX $0.56 221.5 124 0 19 19 104 Shea Creek Saskatchewan 1.5 69.3 84.0 0.40% 69.90 1.51 1.24Uracan Resources, Ltd. URC TSXV $0.03 132.8 3 0 0 0 3 North Shore Quebec - 6.8 43.8 0.01% - 0.48 0.07Uranerz Energy Corp. URZ TSX $1.49 77.2 115 0 28 28 86 Nichols Ranch Wyoming - 15.7 19.1 0.11% - 5.51 4.54<strong>Uranium</strong> Resources, Inc. URRE NASDAQ $0.55 106.1 58 0 10 9 48 Kingsville Dome New Mexico 0.7 102.1 102.1 0.15% 73.96 0.47 0.47UR-Energy Inc. URE TSX $0.67 121.1 81 0 37 37 44 Lost Creek Wyoming - 21.2 75.3 0.05% - 2.08 0.59Weighted Average Avg. 1,768.61 3.79 1.24Straight Average 481.28 1.64 0.70Source: Company reports, CapitalIQ, UxC, TradeTech, Raymond James Ltd.Notes: Enterprise Value (EV) = market capitalization + net debt; "All" resource category may include inferred <strong>and</strong> historic, non-43-101 compliant resources; Average is weighted by EV (US$)10.009.008.248.258.006.68Inf M&I 2P avg.7.00US$ EV/lb (Total Inventory)6.005.004.00Avg. = 4.742.164.543.002.872.001.000.000.25Avg. = 0.70ERAUEC0.000.020.070.070.10PDN0.10AREVACCOUUU0.11CZQEFRTUURC0.12ACB0.240.260.310.450.470.490.500.550.590.620.70STM0.85GEM0.961.01BAN1.241.271.381.651.72YELMEYSHEGGGEMAURREPWEDYLBKYUREMGAFSYLAMUWEPENUEXRGTKIVRSCDMLURZPRODUCERSDEVELOPERS / EXPLORERSRaymond James Ltd. | 2200 – 925 West Georgia Street | Vancouver BC Canada V6C 3L2


