- Page 1 and 2:
CoastGIS Conference 2013: Monitorin
- Page 3 and 4:
Sponsors
- Page 5 and 6:
Steering Committee Secretariat main
- Page 7 and 8:
Santos Basin, BrazilA.F. Romero, R.
- Page 9 and 10:
Coastline development and associate
- Page 11 and 12:
Visual resource management system f
- Page 13 and 14:
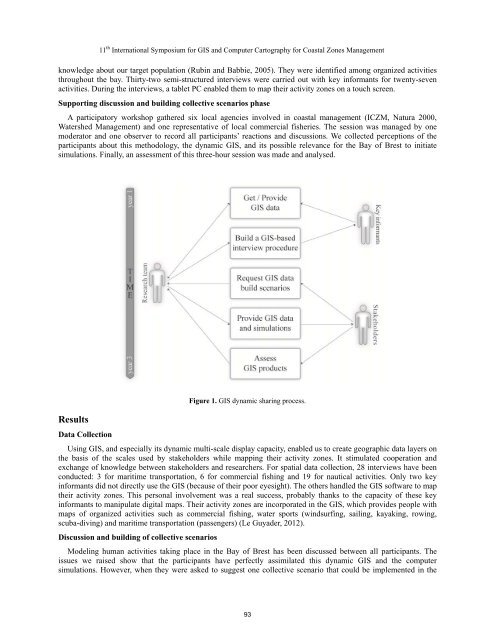
11 th International Symposium for G
- Page 15 and 16:
Use of Terrestrial-LiDAR for quanti
- Page 17 and 18:
11 th International Symposium for G
- Page 19 and 20:
11 th International Symposium for G
- Page 21 and 22:
11 th International Symposium for G
- Page 23 and 24:
11 th International Symposium for G
- Page 25 and 26:
Community beach monitoring: utilisi
- Page 27 and 28:
11 th International Symposium for G
- Page 29 and 30:
Data policy implications arising fr
- Page 31 and 32:
11 th International Symposium for G
- Page 33 and 34:
Global ocean observing system for w
- Page 35 and 36:
11 th International Symposium for G
- Page 38 and 39:
11 th International Symposium for G
- Page 40 and 41:
11 th International Symposium for G
- Page 42 and 43:
11 th International Symposium for G
- Page 44 and 45:
11 th International Symposium for G
- Page 46 and 47:
ResultsMetadata11 th International
- Page 48 and 49:
11 th International Symposium for G
- Page 50 and 51:
11 th International Symposium for G
- Page 52 and 53: Coastal vulnerability index to glob
- Page 54 and 55: 11 th International Symposium for G
- Page 56 and 57: generating probabilities contours f
- Page 58 and 59: maps, the most critical conditions
- Page 60 and 61: 11 th International Symposium for G
- Page 62 and 63: 11 th International Symposium for G
- Page 64 and 65: 11 th International Symposium for G
- Page 66 and 67: 11 th International Symposium for G
- Page 68 and 69: Statistical and spatial toolbox for
- Page 70 and 71: 11 th International Symposium for G
- Page 72 and 73: Global oceans and marine planning
- Page 74 and 75: Analysis11 th International Symposi
- Page 76 and 77: Building scenarios and visualizatio
- Page 78 and 79: 11 th International Symposium for G
- Page 80 and 81: Using a 3D physics-based visualizat
- Page 82 and 83: 11 th International Symposium for G
- Page 84 and 85: Documenting situated tsunami risk p
- Page 86 and 87: 11 th International Symposium for G
- Page 88 and 89: 11 th International Symposium for G
- Page 90 and 91: 11 th International Symposium for G
- Page 92 and 93: SeaSketch11 th International Sympos
- Page 94 and 95: A structured model to enable coasta
- Page 96 and 97: 11 th International Symposium for G
- Page 98 and 99: Developing and testing approaches f
- Page 100 and 101: 11 th International Symposium for G
- Page 104 and 105: 11 th International Symposium for G
- Page 106 and 107: GIS spatio-temporal modeling of hum
- Page 108 and 109: ResultsCollected data11 th Internat
- Page 110 and 111: The use of GIS and geospatial techn
- Page 112 and 113: 11 th International Symposium for G
- Page 114 and 115: Ocean Radar for Monitoring of the C
- Page 116 and 117: 11 th International Symposium for G
- Page 118 and 119: Geophysical investigations of marin
- Page 120 and 121: 11 th International Symposium for G
- Page 122 and 123: A semi-supervised learning framewor
- Page 124 and 125: 11 th International Symposium for G
- Page 126 and 127: Simulation of maritime paths taking
- Page 128 and 129: 11 th International Symposium for G
- Page 130 and 131: COINAtlantic: Sharing through open
- Page 132 and 133: 11 th International Symposium for G
- Page 134 and 135: Implementation of the marine data i
- Page 136 and 137: Perspectives11 th International Sym
- Page 138 and 139: 11 th International Symposium for G
- Page 140 and 141: 11 th International Symposium for G
- Page 142 and 143: 11 th International Symposium for G
- Page 144 and 145: 11 th International Symposium for G
- Page 146 and 147: 11 th International Symposium for G
- Page 148 and 149: References11 th International Sympo
- Page 150 and 151: 11 th International Symposium for G
- Page 152 and 153:
11 th International Symposium for G
- Page 154 and 155:
11 th International Symposium for G
- Page 156 and 157:
Conclusion11 th International Sympo
- Page 158 and 159:
11 th International Symposium for G
- Page 160 and 161:
11 th International Symposium for G
- Page 162 and 163:
11 th International Symposium for G
- Page 164 and 165:
11 th International Symposium for G
- Page 166 and 167:
11 th International Symposium for G
- Page 168 and 169:
11 th International Symposium for G
- Page 170 and 171:
Tools and best practices for coasta
- Page 172 and 173:
11 th International Symposium for G
- Page 174 and 175:
11 th International Symposium for G
- Page 176 and 177:
11 th International Symposium for G
- Page 178 and 179:
Washington Coastal Atlas: creating
- Page 180 and 181:
11 th International Symposium for G
- Page 182 and 183:
The African Coastal and Marine Atla
- Page 184 and 185:
11 th International Symposium for G
- Page 186 and 187:
11 th International Symposium for G
- Page 188 and 189:
11 th International Symposium for G
- Page 190 and 191:
11 th International Symposium for G
- Page 192 and 193:
11 th International Symposium for G
- Page 194 and 195:
11 th International Symposium for G
- Page 196 and 197:
11 th International Symposium for G
- Page 198 and 199:
Methods11 th International Symposiu
- Page 200 and 201:
11 th International Symposium for G
- Page 202 and 203:
Methods11 th International Symposiu
- Page 204 and 205:
11 th International Symposium for G
- Page 206 and 207:
11 th International Symposium for G
- Page 208 and 209:
Acknowledgments11 th International
- Page 210 and 211:
11 th International Symposium for G
- Page 212 and 213:
11 th International Symposium for G
- Page 214 and 215:
11 th International Symposium for G
- Page 216 and 217:
Long-term continuous observations o
- Page 218 and 219:
11 th International Symposium for G
- Page 220 and 221:
Comparing endmember extraction meth
- Page 222 and 223:
11 th International Symposium for G
- Page 224 and 225:
Integration of scientific data as a
- Page 226 and 227:
11 th International Symposium for G
- Page 228 and 229:
11 th International Symposium for G
- Page 230:
Conclusions11 th International Symp