

Download PDF - COINAtlantic
Download PDF - COINAtlantic
Download PDF - COINAtlantic
- No tags were found...

Create successful ePaper yourself
Turn your PDF publications into a flip-book with our unique Google optimized e-Paper software.
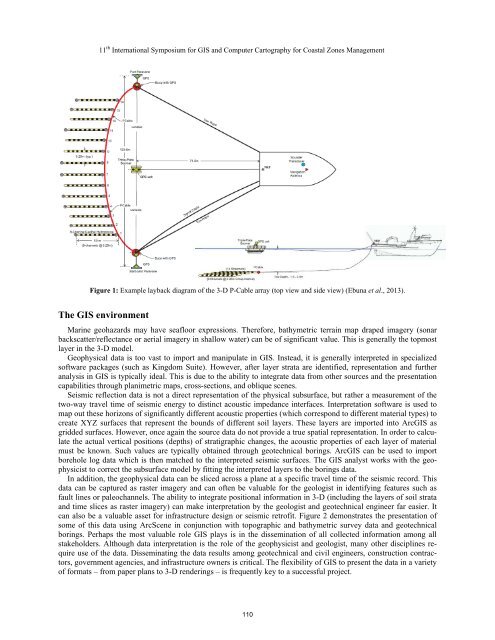
11 th International Symposium for GIS and Computer Cartography for Coastal Zones ManagementFigure 1: Example layback diagram of the 3-D P-Cable array (top view and side view) (Ebuna et al., 2013).The GIS environmentMarine geohazards may have seafloor expressions. Therefore, bathymetric terrain map draped imagery (sonarbackscatter/reflectance or aerial imagery in shallow water) can be of significant value. This is generally the topmostlayer in the 3-D model.Geophysical data is too vast to import and manipulate in GIS. Instead, it is generally interpreted in specializedsoftware packages (such as Kingdom Suite). However, after layer strata are identified, representation and furtheranalysis in GIS is typically ideal. This is due to the ability to integrate data from other sources and the presentationcapabilities through planimetric maps, cross-sections, and oblique scenes.Seismic reflection data is not a direct representation of the physical subsurface, but rather a measurement of thetwo-way travel time of seismic energy to distinct acoustic impedance interfaces. Interpretation software is used tomap out these horizons of significantly different acoustic properties (which correspond to different material types) tocreate XYZ surfaces that represent the bounds of different soil layers. These layers are imported into ArcGIS asgridded surfaces. However, once again the source data do not provide a true spatial representation. In order to calculatethe actual vertical positions (depths) of stratigraphic changes, the acoustic properties of each layer of materialmust be known. Such values are typically obtained through geotechnical borings. ArcGIS can be used to importborehole log data which is then matched to the interpreted seismic surfaces. The GIS analyst works with the geophysicistto correct the subsurface model by fitting the interpreted layers to the borings data.In addition, the geophysical data can be sliced across a plane at a specific travel time of the seismic record. Thisdata can be captured as raster imagery and can often be valuable for the geologist in identifying features such asfault lines or paleochannels. The ability to integrate positional information in 3-D (including the layers of soil strataand time slices as raster imagery) can make interpretation by the geologist and geotechnical engineer far easier. Itcan also be a valuable asset for infrastructure design or seismic retrofit. Figure 2 demonstrates the presentation ofsome of this data using ArcScene in conjunction with topographic and bathymetric survey data and geotechnicalborings. Perhaps the most valuable role GIS plays is in the dissemination of all collected information among allstakeholders. Although data interpretation is the role of the geophysicist and geologist, many other disciplines requireuse of the data. Disseminating the data results among geotechnical and civil engineers, construction contractors,government agencies, and infrastructure owners is critical. The flexibility of GIS to present the data in a varietyof formats – from paper plans to 3-D renderings – is frequently key to a successful project.110


