

Download PDF - COINAtlantic
Download PDF - COINAtlantic
Download PDF - COINAtlantic
- No tags were found...

Create successful ePaper yourself
Turn your PDF publications into a flip-book with our unique Google optimized e-Paper software.
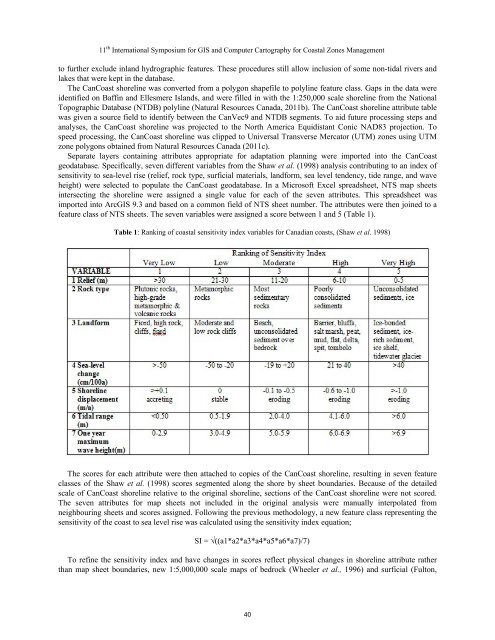
11 th International Symposium for GIS and Computer Cartography for Coastal Zones Managementto further exclude inland hydrographic features. These procedures still allow inclusion of some non-tidal rivers andlakes that were kept in the database.The CanCoast shoreline was converted from a polygon shapefile to polyline feature class. Gaps in the data wereidentified on Baffin and Ellesmere Islands, and were filled in with the 1:250,000 scale shoreline from the NationalTopographic Database (NTDB) polyline (Natural Resources Canada, 2011b). The CanCoast shoreline attribute tablewas given a source field to identify between the CanVec9 and NTDB segments. To aid future processing steps andanalyses, the CanCoast shoreline was projected to the North America Equidistant Conic NAD83 projection. Tospeed processing, the CanCoast shoreline was clipped to Universal Transverse Mercator (UTM) zones using UTMzone polygons obtained from Natural Resources Canada (2011c).Separate layers containing attributes appropriate for adaptation planning were imported into the CanCoastgeodatabase. Specifically, seven different variables from the Shaw et al. (1998) analysis contributing to an index ofsensitivity to sea-level rise (relief, rock type, surficial materials, landform, sea level tendency, tide range, and waveheight) were selected to populate the CanCoast geodatabase. In a Microsoft Excel spreadsheet, NTS map sheetsintersecting the shoreline were assigned a single value for each of the seven attributes. This spreadsheet wasimported into ArcGIS 9.3 and based on a common field of NTS sheet number. The attributes were then joined to afeature class of NTS sheets. The seven variables were assigned a score between 1 and 5 (Table 1).Table 1: Ranking of coastal sensitivity index variables for Canadian coasts, (Shaw et al. 1998)The scores for each attribute were then attached to copies of the CanCoast shoreline, resulting in seven featureclasses of the Shaw et al. (1998) scores segmented along the shore by sheet boundaries. Because of the detailedscale of CanCoast shoreline relative to the original shoreline, sections of the CanCoast shoreline were not scored.The seven attributes for map sheets not included in the original analysis were manually interpolated fromneighbouring sheets and scores assigned. Following the previous methodology, a new feature class representing thesensitivity of the coast to sea level rise was calculated using the sensitivity index equation;SI = √((a1*a2*a3*a4*a5*a6*a7)/7)To refine the sensitivity index and have changes in scores reflect physical changes in shoreline attribute ratherthan map sheet boundaries, new 1:5,000,000 scale maps of bedrock (Wheeler et al., 1996) and surficial (Fulton,40


