

Download PDF - COINAtlantic
Download PDF - COINAtlantic
Download PDF - COINAtlantic
- No tags were found...

You also want an ePaper? Increase the reach of your titles
YUMPU automatically turns print PDFs into web optimized ePapers that Google loves.
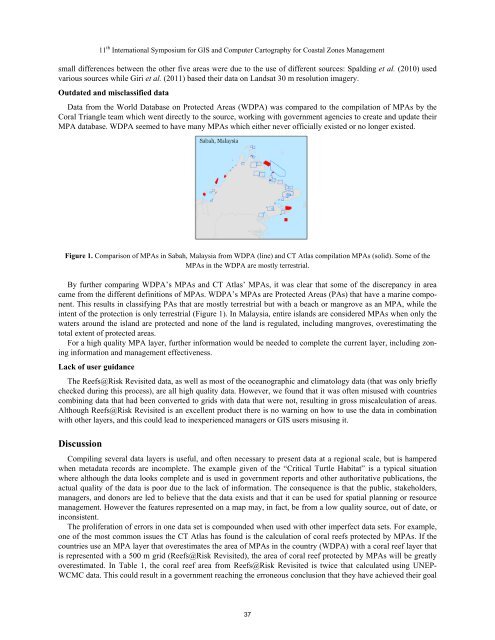
11 th International Symposium for GIS and Computer Cartography for Coastal Zones Managementsmall differences between the other five areas were due to the use of different sources: Spalding et al. (2010) usedvarious sources while Giri et al. (2011) based their data on Landsat 30 m resolution imagery.Outdated and misclassified dataData from the World Database on Protected Areas (WDPA) was compared to the compilation of MPAs by theCoral Triangle team which went directly to the source, working with government agencies to create and update theirMPA database. WDPA seemed to have many MPAs which either never officially existed or no longer existed.Figure 1. Comparison of MPAs in Sabah, Malaysia from WDPA (line) and CT Atlas compilation MPAs (solid). Some of theMPAs in the WDPA are mostly terrestrial.By further comparing WDPA’s MPAs and CT Atlas’ MPAs, it was clear that some of the discrepancy in areacame from the different definitions of MPAs. WDPA’s MPAs are Protected Areas (PAs) that have a marine component.This results in classifying PAs that are mostly terrestrial but with a beach or mangrove as an MPA, while theintent of the protection is only terrestrial (Figure 1). In Malaysia, entire islands are considered MPAs when only thewaters around the island are protected and none of the land is regulated, including mangroves, overestimating thetotal extent of protected areas.For a high quality MPA layer, further information would be needed to complete the current layer, including zoninginformation and management effectiveness.Lack of user guidanceThe Reefs@Risk Revisited data, as well as most of the oceanographic and climatology data (that was only brieflychecked during this process), are all high quality data. However, we found that it was often misused with countriescombining data that had been converted to grids with data that were not, resulting in gross miscalculation of areas.Although Reefs@Risk Revisited is an excellent product there is no warning on how to use the data in combinationwith other layers, and this could lead to inexperienced managers or GIS users misusing it.DiscussionCompiling several data layers is useful, and often necessary to present data at a regional scale, but is hamperedwhen metadata records are incomplete. The example given of the “Critical Turtle Habitat” is a typical situationwhere although the data looks complete and is used in government reports and other authoritative publications, theactual quality of the data is poor due to the lack of information. The consequence is that the public, stakeholders,managers, and donors are led to believe that the data exists and that it can be used for spatial planning or resourcemanagement. However the features represented on a map may, in fact, be from a low quality source, out of date, orinconsistent.The proliferation of errors in one data set is compounded when used with other imperfect data sets. For example,one of the most common issues the CT Atlas has found is the calculation of coral reefs protected by MPAs. If thecountries use an MPA layer that overestimates the area of MPAs in the country (WDPA) with a coral reef layer thatis represented with a 500 m grid (Reefs@Risk Revisited), the area of coral reef protected by MPAs will be greatlyoverestimated. In Table 1, the coral reef area from Reefs@Risk Revisited is twice that calculated using UNEP-WCMC data. This could result in a government reaching the erroneous conclusion that they have achieved their goal37


