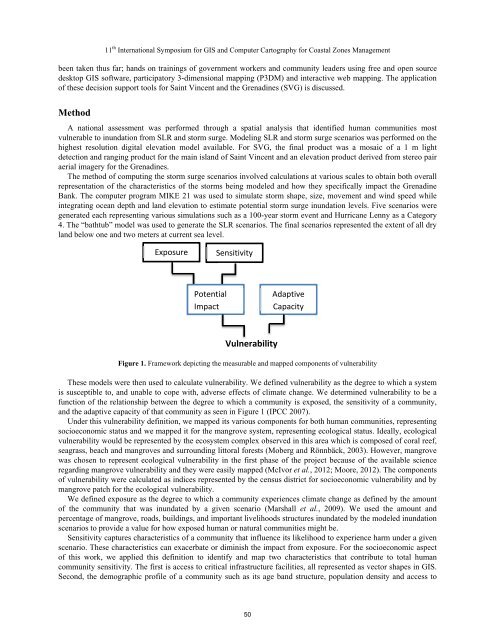
11 th International Symposium for GIS and Computer Cartography for Coastal Zones Managementbeen taken thus far; hands on trainings of government workers and community leaders using free and open sourcedesktop GIS software, participatory 3-dimensional mapping (P3DM) and interactive web mapping. The applicationof these decision support tools for Saint Vincent and the Grenadines (SVG) is discussed.MethodA national assessment was performed through a spatial analysis that identified human communities mostvulnerable to inundation from SLR and storm surge. Modeling SLR and storm surge scenarios was performed on thehighest resolution digital elevation model available. For SVG, the final product was a mosaic of a 1 m lightdetection and ranging product for the main island of Saint Vincent and an elevation product derived from stereo pairaerial imagery for the Grenadines.The method of computing the storm surge scenarios involved calculations at various scales to obtain both overallrepresentation of the characteristics of the storms being modeled and how they specifically impact the GrenadineBank. The computer program MIKE 21 was used to simulate storm shape, size, movement and wind speed whileintegrating ocean depth and land elevation to estimate potential storm surge inundation levels. Five scenarios weregenerated each representing various simulations such as a 100-year storm event and Hurricane Lenny as a Category4. The “bathtub” model was used to generate the SLR scenarios. The final scenarios represented the extent of all dryland below one and two meters at current sea level.ExposureSensitivityPotentialImpactAdaptiveCapacityVulnerabilityFigure 1. Framework depicting the measurable and mapped components of vulnerabilityThese models were then used to calculate vulnerability. We defined vulnerability as the degree to which a systemis susceptible to, and unable to cope with, adverse effects of climate change. We determined vulnerability to be afunction of the relationship between the degree to which a community is exposed, the sensitivity of a community,and the adaptive capacity of that community as seen in Figure 1 (IPCC 2007).Under this vulnerability definition, we mapped its various components for both human communities, representingsocioeconomic status and we mapped it for the mangrove system, representing ecological status. Ideally, ecologicalvulnerability would be represented by the ecosystem complex observed in this area which is composed of coral reef,seagrass, beach and mangroves and surrounding littoral forests (Moberg and Rönnbäck, 2003). However, mangrovewas chosen to represent ecological vulnerability in the first phase of the project because of the available scienceregarding mangrove vulnerability and they were easily mapped (McIvor et al., 2012; Moore, 2012). The componentsof vulnerability were calculated as indices represented by the census district for socioeconomic vulnerability and bymangrove patch for the ecological vulnerability.We defined exposure as the degree to which a community experiences climate change as defined by the amountof the community that was inundated by a given scenario (Marshall et al., 2009). We used the amount andpercentage of mangrove, roads, buildings, and important livelihoods structures inundated by the modeled inundationscenarios to provide a value for how exposed human or natural communities might be.Sensitivity captures characteristics of a community that influence its likelihood to experience harm under a givenscenario. These characteristics can exacerbate or diminish the impact from exposure. For the socioeconomic aspectof this work, we applied this definition to identify and map two characteristics that contribute to total humancommunity sensitivity. The first is access to critical infrastructure facilities, all represented as vector shapes in GIS.Second, the demographic profile of a community such as its age band structure, population density and access to50
11 th International Symposium for GIS and Computer Cartography for Coastal Zones Managementradio and internet for example. For the ecological aspect of this work, we characterized the size, shape, openness tothe coast and habitat type to name a few to represent mangrove sensitivity.Adaptive capacity describes the ability of a system to anticipate, respond to, cope with, and recover from climateimpacts. In this analysis, we mapped adaptive capacity using census data representing the highest level of educationattained and available workforce for example. For the ecological aspect, adaptive capacity of mangrove wasrepresented by their ability to migrate which incorporated surrounding slope, elevation and adjacent land use toname a few.Although the information was used to assess national vulnerability for SVG, its biggest use has been tocommunicate and visualize the concept of EBA to the intended audience. However, the characteristics across thisintended audience varied greatly. Depending on the audience member, the perspective to how this information wasviewed varied by scale (i.e. local, national and regional or global). Moreover, the way audience members accessedthis information also varied. For some, GIS experience was not necessary, thus accessing this information throughGIS software and spatial datasets did not make sense. However, some audience members need access to the actualGIS information. For some audience members internet connectivity is good, for others it is poor. To best fit thevarious needs and characteristics of the intended audience, three approaches were taken; interactive web mapping,hands on training of government workers and community leaders using free and open source desktop GIS softwareand participatory 3-dimensional mapping (P3DM).For audience members who are not trained in GIS, but have good internet, we set up an interactive web mapthrough the Coastal Resilience website (coastalresilience.org). The Coastal Resilience website details the broaderframework of coastal resilience, where EBA is nested (The Nature Conservancy, 2013). This allows audiencemembers who visit this site to understand the broader context from which this work rests. It also gives an overviewof the project’s goals and objectives as well as provides the visual component of the data used and produced. Manyof the spatial data layers are accessible, allowing viewers to turn them on and off. This format has been ideal forinternational development agencies, funders and outside regional interests to view what has been done.For audience members who are trained in GIS, need access to the actual spatial data, do not have good internetconnection and cannot afford proprietary GIS software we held a training using free and open source GIS desktopsoftware. Through this effort, participants were able to download QGIS onto their personal desktops and begin totake a closer look at the spatial dataset, including metadata, naming convention, attribute tables and spatial extentand limitations (Quantum GIS Development Team, 2013). This provided an ideal opportunity for governmenttechnocrats to figure out how best this information can be applied to their work whether it is physical planning ordisaster management.For audience members who are not trained in GIS and do not have good internet connection, we helped fund aP3DM process (Rambaldi 2010). This process was completed in Union Island at a very local scale. Although somegovernment workers attended, the process was mainly community led and built. Through this process, the ideasabout what the community was concerned with and what they wanted to focus on were realized.The measure of actual change of perception at the community level will be worked into a Red Cross survey. Theintent is to measure the community’s perception of vulnerability before and after the installation of an EBA solution.We have anecdotal evidence that the approaches taken thus far are impacting perceptions.ConclusionDecisions can be made to reduce vulnerability of human communities that incorporate natural solutions, analternative to traditional and contemporary grey infrastructure. In order to facilitate the decision making process, theAWE project is working to change existing perceptions on how to reduce vulnerability by demonstrating thefeasibility of nature based solutions and applying a host of mapping and visualization decision support tools. InSVG, the project has provided a set of tools for public education. In addition, the information collected andgenerated for the project has anecdotally raised awareness among decision makers about how they can individuallyand collectively adapt and strengthen coastal communities’ climate change resilience.AcknowledgmentsThis project was funded through the generous donation of a private donor. We wish to acknowledge theleadership of Ms. Ruth Blyther (TNC Eastern Caribbean Country Representative) and the hard work and51