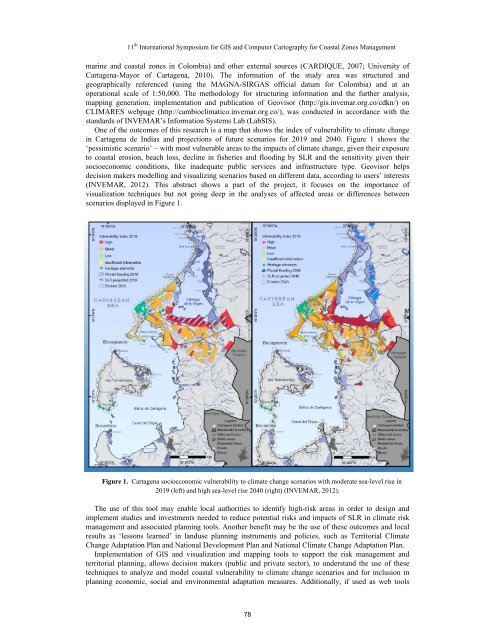
11 th International Symposium for GIS and Computer Cartography for Coastal Zones Managementmarine and coastal zones in Colombia) and other external sources (CARDIQUE, 2007; University ofCartagena-Mayor of Cartagena, 2010). The information of the study area was structured andgeographically referenced (using the MAGNA-SIRGAS official datum for Colombia) and at anoperational scale of 1:50,000. The methodology for structuring information and the further analysis,mapping generation, implementation and publication of Geovisor (http://gis.invemar.org.co/cdkn/) onCLIMARES webpage (http://cambioclimatico.invemar.org.co/), was conducted in accordance with thestandards of INVEMAR’s Information Systems Lab (LabSIS).One of the outcomes of this research is a map that shows the index of vulnerability to climate changein Cartagena de Indias and projections of future scenarios for 2019 and 2040. Figure 1 shows the‘pessimistic scenario’ – with most vulnerable areas to the impacts of climate change, given their exposureto coastal erosion, beach loss, decline in fisheries and flooding by SLR and the sensitivity given theirsocioeconomic conditions, like inadequate public services and infrastructure type. Geovisor helpsdecision makers modelling and visualizing scenarios based on different data, according to users’ interests(INVEMAR, 2012). This abstract shows a part of the project, it focuses on the importance ofvisualization techniques but not going deep in the analyses of affected areas or differences betweenscenarios displayed in Figure 1.Figure 1. Cartagena socioeconomic vulnerability to climate change scenarios with moderate sea-level rise in2019 (left) and high sea-level rise 2040 (right) (INVEMAR, 2012).The use of this tool may enable local authorities to identify high-risk areas in order to design andimplement studies and investments needed to reduce potential risks and impacts of SLR in climate riskmanagement and associated planning tools. Another benefit may be the use of these outcomes and localresults as ‘lessons learned’ in landuse planning instruments and policies, such as Territorial ClimateChange Adaptation Plan and National Development Plan and National Climate Change Adaptation Plan.Implementation of GIS and visualization and mapping tools to support the risk management andterritorial planning, allows decision makers (public and private sector), to understand the use of thesetechniques to analyze and model coastal vulnerability to climate change scenarios and for inclusion inplanning economic, social and environmental adaptation measures. Additionally, if used as web tools78
11 th International Symposium for GIS and Computer Cartography for Coastal Zones Management(such as Geovisor and CLIMARES webpage services), it may facilitate consultation by differentstakeholders and directly support decision-making process in sectors affected by climate change effects(Vides et al., 2013). CLIMARES is being tested by local authorities.ConclusionsVisualization tools help inform vulnerability assessment and adaptation guidelines includingrequirements and approval from all stakeholders involved in the coastal study area. INVEMAR and theirlocal, national and international partners hope that these visualization tools will establish an example forColombia (and urban coastal cities beyond) of how these techniques based on GIS, Geomatics andGeodesy are supporting land use planning and adaptation processes using a pilot site like Cartagena deIndias urban city located in the Colombian Caribbean coast. This research is ongoing, particularly interms of incorporating information and disseminating it across local and national stakeholder groups inorder to test and improve CLIMARES webpage and Geovisor.AcknowledgmentsThe Marine and Coastal Research Institute (INVEMAR), Mayor of Cartagena de Indias, CDKN,Ministry of Environment and Sustainable Development (MADS), Cámara de Comercio, and all Local andNational Environmental Entities who are supporting and are supported by Geovisor and CLIMARESwebsite services.“Part of the results include in this paper is an output from a project funded by the UK Department forInternational Development (DFID) for the benefit of developing countries. However the views expressedand information contained in it are not necessarily those of or endorsed by DFID, which can accept noresponsibility for such views or information or for any reliance placed on them”.ReferencesCARDIQUE- Corporación Autónoma Regional del Canal del Dique (2007), Actualización de la zonificación demanglares en la jurisdicción de CARDIQUE, Cartagena de Indias, Colombia, 245p.INVEMAR - Instituto de Investigaciones Marinas y Costeras “José Benito Vives De Andreis” (2003), Definición dela vulnerabilidad de los sistemas bio-geofísicos y socioeconómicos debido a un cambio en el nivel del mar en lazona costera colombiana (Caribe continental, Caribe insular y Pacífico) y medidas para su adaptación. Ed. M.P.Vides, pp. VII Tomos, Resumen Ejecutivo y CD Atlas digital. INVEMAR, Santa Marta, Colombia.INVEMAR - Instituto de Investigaciones Marinas y Costeras “José Benito Vives De Andreis, MADS – Ministerio deAmbiente y Desarrollo Territorial & Alcaldía Mayor de Cartagena de Indias (2012), Lineamientos para laadaptación al cambio climático de Cartagena de Indias. Proyecto Integración de la Adaptación al CambioClimático en la Planificación Territorial y Gestión Sectorial de Cartagena de Indias. Editores: Rojas, G.X., J.Blanco y F. Navarrete. Cartagena. Serie de documentos especiales del INVEMAR No. 55, 40p.INVEMAR - Instituto de Investigaciones Marinas y Costeras “José Benito Vives De Andreis” (2008), Construcciónde capacidades para mejorar la capacidad de adaptación al ascenso en el nivel del mar en dos áreas vulnerablesde las zonas costeras de Colombia (Tumaco - Pacífico, Cartagena de Indias - Caribe). Informe Técnico delProyecto Colombia NCAP. ETC Número del Proyecto 032135. Instituto de Investigaciones Marinas y Costeras.INVEMAR. Santa Marta, Colombia. 290p.Pettit, C., S. Williams, I. Bishop, J.P. Aurambout, A.B.M. Russel, A. Michael, S. Sharma, et al. (2013), Building anecoinformatics platform to support climate change adaptation in Victoria. Future Generation Computer Systems,29(2):624–640SNC - Segunda Comunicación Nacional ante la Convención Marco de las Naciones Unidas sobre Cambio Climático(2010), editado por IDEAM. Bogotá, Colombia, 7 capítulos, 437p.Stojanovic, T., D.R. Green, and G. Lymbery (2012), Approaches to knowledge sharing and capacity building: therole of local information systems in marine and coastal management. Ocean & Coastal Management, 53(12):805–815Universidad de Cartagena - Alcaldía de Cartagena de Indias (2010), Valoración de niveles de riesgos ambientales enel Distrito de Cartagena de Indias. Informe final diagnostico línea base ambiental Cartagena de Indias. Tomo IIDiagnóstico ambiental Cartagena. Convenio interadministrativo No. 293. Instituto de Hidráulica y SaneamientoAmbiental - IHSA. Universidad de Cartagena - Alcaldía de Cartagena de Indias, Colombia, 215 p.79