Download PDF - COINAtlantic
Download PDF - COINAtlantic
Download PDF - COINAtlantic
- No tags were found...
Create successful ePaper yourself
Turn your PDF publications into a flip-book with our unique Google optimized e-Paper software.
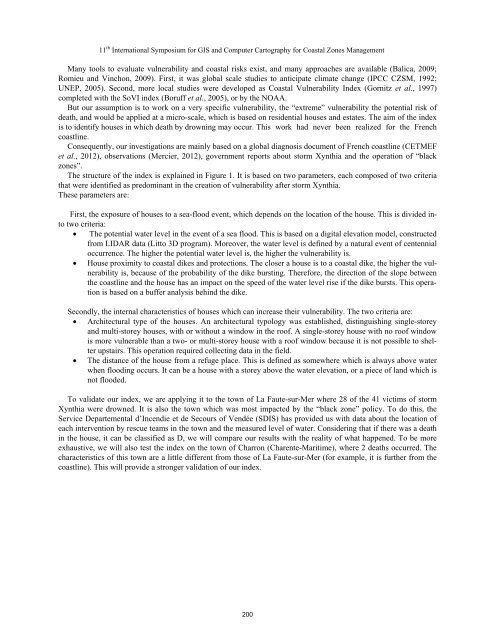
11 th International Symposium for GIS and Computer Cartography for Coastal Zones ManagementMany tools to evaluate vulnerability and coastal risks exist, and many approaches are available (Balica, 2009;Romieu and Vinchon, 2009). First, it was global scale studies to anticipate climate change (IPCC CZSM, 1992;UNEP, 2005). Second, more local studies were developed as Coastal Vulnerability Index (Gornitz et al., 1997)completed with the SoVI index (Boruff et al., 2005), or by the NOAA.But our assumption is to work on a very specific vulnerability, the “extreme” vulnerability the potential risk ofdeath, and would be applied at a micro-scale, which is based on residential houses and estates. The aim of the indexis to identify houses in which death by drowning may occur. This work had never been realized for the Frenchcoastline.Consequently, our investigations are mainly based on a global diagnosis document of French coastline (CETMEFet al., 2012), observations (Mercier, 2012), government reports about storm Xynthia and the operation of “blackzones”.The structure of the index is explained in Figure 1. It is based on two parameters, each composed of two criteriathat were identified as predominant in the creation of vulnerability after storm Xynthia.These parameters are:First, the exposure of houses to a sea-flood event, which depends on the location of the house. This is divided intotwo criteria: The potential water level in the event of a sea flood. This is based on a digital elevation model, constructedfrom LIDAR data (Litto 3D program). Moreover, the water level is defined by a natural event of centennialoccurrence. The higher the potential water level is, the higher the vulnerability is. House proximity to coastal dikes and protections. The closer a house is to a coastal dike, the higher the vulnerabilityis, because of the probability of the dike bursting. Therefore, the direction of the slope betweenthe coastline and the house has an impact on the speed of the water level rise if the dike bursts. This operationis based on a buffer analysis behind the dike.Secondly, the internal characteristics of houses which can increase their vulnerability. The two criteria are: Architectural type of the houses. An architectural typology was established, distinguishing single-storeyand multi-storey houses, with or without a window in the roof. A single-storey house with no roof windowis more vulnerable than a two- or multi-storey house with a roof window because it is not possible to shelterupstairs. This operation required collecting data in the field. The distance of the house from a refuge place. This is defined as somewhere which is always above waterwhen flooding occurs. It can be a house with a storey above the water elevation, or a piece of land which isnot flooded.To validate our index, we are applying it to the town of La Faute-sur-Mer where 28 of the 41 victims of stormXynthia were drowned. It is also the town which was most impacted by the “black zone” policy. To do this, theService Departemental d’Incendie et de Secours of Vendée (SDIS) has provided us with data about the location ofeach intervention by rescue teams in the town and the measured level of water. Considering that if there was a deathin the house, it can be classified as D, we will compare our results with the reality of what happened. To be moreexhaustive, we will also test the index on the town of Charron (Charente-Maritime), where 2 deaths occurred. Thecharacteristics of this town are a little different from those of La Faute-sur-Mer (for example, it is further from thecoastline). This will provide a stronger validation of our index.200


