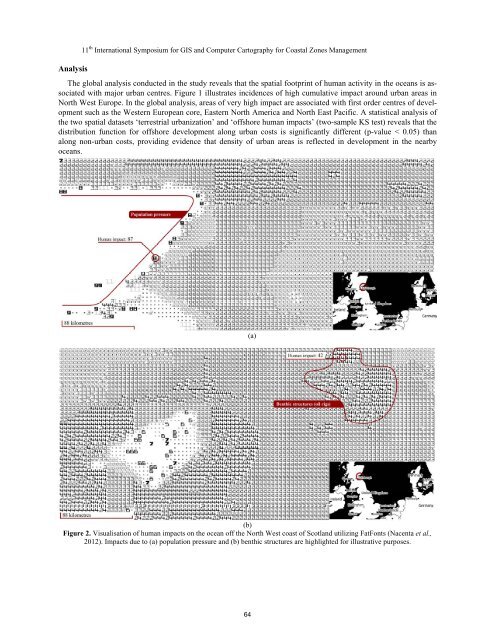
Analysis11 th International Symposium for GIS and Computer Cartography for Coastal Zones ManagementThe global analysis conducted in the study reveals that the spatial footprint of human activity in the oceans is associatedwith major urban centres. Figure 1 illustrates incidences of high cumulative impact around urban areas inNorth West Europe. In the global analysis, areas of very high impact are associated with first order centres of developmentsuch as the Western European core, Eastern North America and North East Pacific. A statistical analysis ofthe two spatial datasets ‘terrestrial urbanization’ and ‘offshore human impacts’ (two-sample KS test) reveals that thedistribution function for offshore development along urban costs is significantly different (p-value < 0.05) thanalong non-urban costs, providing evidence that density of urban areas is reflected in development in the nearbyoceans.(a)(b)Figure 2. Visualisation of human impacts on the ocean off the North West coast of Scotland utilizing FatFonts (Nacenta et al.,2012). Impacts due to (a) population pressure and (b) benthic structures are highlighted for illustrative purposes.64
11 th International Symposium for GIS and Computer Cartography for Coastal Zones ManagementVisualisationWhilst the analysis conducted on the spatial data provides a useful indication of the relationship between terrestrialand offshore development, in order to explore the implications of this global analysis at regional scales thestudy considered various visualization options. One of the major criticisms of GIS outputs is that whilst they providespatially explicit analysis, they fail to provide visual outputs in a form suitable for decision making. The study renderedthe marine impacts model using the fatfonts numerical typeface (Nacenta et al., 2012). The approach has theadvantage of maintaining the link between data and graphical expression. Figure 2 illustrates a fatfont visualisationwhich shows both key values and spatial patterns, thereby illustrating high cumulative impacts near urban coastalareas, in a way which is obscured by the global raster model. In this visualisation, sub-areas of the global dataset areshown, focusing specifically on North West Scotland. Here it is possible to represent the human impacts data directlyas well as cartographically due to the link between numeric value and the amount of ink used to render each value(i.e., a value of 9 uses 9 times more ink than a value of 1). For illustrative purposes, we highlight two specific areasof human impacts on the coasts of North West Scotland: population pressure and benthic structures (e.g., oil rigs),both of which are associated with high impact values.ConclusionData quality and coverage issues remain a significant impediment for spatial analysis in the marine environment.For example, the cumulative impacts model presented in this paper would benefit from improved coverage of humanactivities in the oceans. Nevertheless, GIS provides the means to combine multiple data-sources across scales andregions, and facilitates spatial analysis to support Marine Spatial Planning. The paper provides an example thatmoves beyond spatial coverages and overlays, to conduct exploratory data analysis to test hypotheses about significantchanges in the oceans. Marine spatial planning will also require careful consideration of visualisation options,so that geographically accurate analysis can be complemented by conveying comprehensive information on the stateof the marine environment, using visualisation techniques which support reasoning and decision-making (Canessa,2008).ReferencesCanessa, R. (2008), "Seascape geovisualization for marine planning". Geomatica, 62(4):375–392.Center for International Earth Science Information Network (CIESIN), Columbia University; International Food Policy ResearchInstitute (IFPRI), The World Bank and Centro Internacional de Agricultura Tropical (CIAT) (2011), Global Rural-UrbanMapping Project, Version 1 (GRUMPv1): Urban Extents Grid. Palisades, NY: NASA Socioeconomic Data and ApplicationsCenter (SEDAC). http://sedac.ciesin.columbia.edu/data/set/grump-v1-urban-extents Accessed 14 January 2013.Halpern, B. S. and S. Walbridge, et al. (2008). "A global map of human impact on marine ecosystems". Science, 319(5865): 948–952.Hijmans, R. J. and J.van Etten, (2012), raster: Geographic analysis and modelling with raster data. R package version 1.9-82,http://CRAN.R-project.org/package=raster.Nacenta, M., U. Hinrichs, and S. Carpendale (2012), “FatFonts: Combining the Symbolic and Visual Aspects of Numbers”. AVI2012 International Working Conference on Advanced Visual Interfaces, Capri Island (Naples), Italy. May 22–25, 2012, ACMNew York, NY, USA.Stelzenmüller, V., J. Lee, A. South, and S.I. Rogers (2009), "Quantifying cumulative impacts of human pressures on the marineenvironment: A geospatial modelling framework". Marine Ecology Progress Series, 398:19–32.St. Martin, K. and M. Hall-Arber (2008), "The missing layer: Geo-technologies, communities, and implications for marine spatialplanning". Marine Policy, 32(5):779–786.Stojanovic, T. and C.J.Q. Farmer (2013), “The development of world oceans & coasts and concepts of sustainability”. MarinePolicy, 42:157–165.Stojanovic, T, D.R. Green and G. Lymbery (2010), “Approaches to knowledge sharing and capacity building: The role of localinformation systems in marine and coastal management”. Ocean & Coastal Management, 53(12):805–815.UNDALOS (2012), A Regular Process for Global Reporting and Assessment of the State of the Marine Environment, IncludingSocio-economic Aspects. http://www.un.org/Depts/los/global_reporting/global_reporting.htm Accessed 14 January 2013.65