

World Investment Report 2009: Transnational Corporations - Unctad
World Investment Report 2009: Transnational Corporations - Unctad
World Investment Report 2009: Transnational Corporations - Unctad

You also want an ePaper? Increase the reach of your titles
YUMPU automatically turns print PDFs into web optimized ePapers that Google loves.
102 <strong>World</strong> <strong>Investment</strong> <strong>Report</strong> <strong>2009</strong>: <strong>Transnational</strong> <strong>Corporations</strong>, Agricultural Production and Development<br />
(e.g. Australia, Canada, France, Germany, the United<br />
Kingdom and the United States) dominated in the<br />
export of wheat (annex table A.III.2).<br />
Agriculture also provides significant<br />
employment opportunities in developing countries<br />
and is a crucial source of livelihood for the rural<br />
poor, in particular women (chapter IV; OECD, 2006).<br />
In 19 developing countries, agriculture accounted<br />
for more than 40% of total employment during<br />
2002–2006. 8 More than 60% of the population<br />
in Africa and Asia live in rural areas, and most of<br />
them are employed in agriculture (table III.3).<br />
While agriculture accounts for more than half of<br />
employment in Africa, wide variations exist within<br />
the region. 9 Similarly, large variations exist in Asia<br />
where employment in agriculture accounted for over<br />
40% of total employment in South, East and South-<br />
East Asia but less than 25% in West Asia during<br />
2002–2006. Effective agricultural growth could<br />
therefore contribute to employment creation and<br />
reduce poverty in developing countries, in line with<br />
MDG-1. 10 Indeed, in poor countries, under the right<br />
conditions, agriculture is at least twice as effective<br />
in reducing poverty as compared to GDP growth<br />
originating outside agriculture (<strong>World</strong> Bank, 2007: 6).<br />
b. Agriculture as a neglected motor for<br />
development<br />
Despite the importance of agriculture as a<br />
motor of development, it has been neglected in many<br />
developing countries (FAO, 2008d; HLTF, 2008).<br />
Region<br />
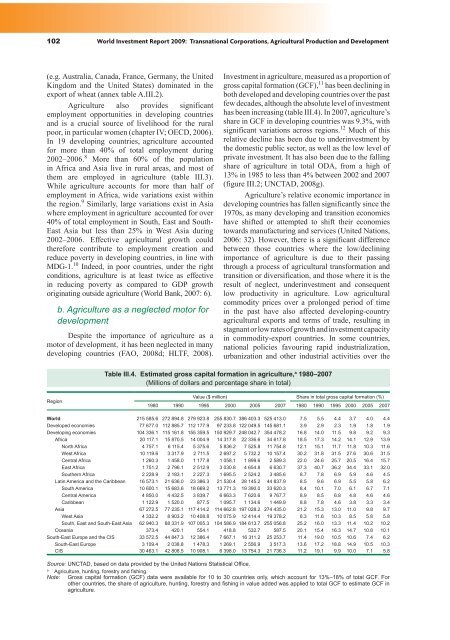
<strong>Investment</strong> in agriculture, measured as a proportion of<br />
gross capital formation (GCF), 11 has been declining in<br />
both developed and developing countries over the past<br />
few decades, although the absolute level of investment<br />
has been increasing (table III.4). In 2007, agriculture’s<br />
share in GCF in developing countries was 9.3%, with<br />
significant variations across regions. 12 Much of this<br />
relative decline has been due to underinvestment by<br />
the domestic public sector, as well as the low level of<br />
private investment. It has also been due to the falling<br />
share of agriculture in total ODA, from a high of<br />
13% in 1985 to less than 4% between 2002 and 2007<br />
(figure III.2; UNCTAD, 2008g).<br />
Agriculture’s relative economic importance in<br />
developing countries has fallen significantly since the<br />
1970s, as many developing and transition economies<br />
have shifted or attempted to shift their economies<br />
towards manufacturing and services (United Nations,<br />
2006: 32). However, there is a significant difference<br />
between those countries where the low/declining<br />
importance of agriculture is due to their passing<br />
through a process of agricultural transformation and<br />
transition or diversification, and those where it is the<br />
result of neglect, underinvestment and consequent<br />
low productivity in agriculture. Low agricultural<br />
commodity prices over a prolonged period of time<br />
in the past have also affected developing-country<br />
agricultural exports and terms of trade, resulting in<br />
stagnant or low rates of growth and investment capacity<br />
in commodity-export countries. In some countries,<br />
national policies favouring rapid industrialization,<br />
urbanization and other industrial activities over the<br />
Table III.4. Estimated gross capital formation in agriculture, a 1980–2007<br />
(Millions of dollars and percentage share in total)<br />
Value ($ million) Share in total gross capital formation (%)<br />
1980 1990 1995 2000 2005 2007 1980 1990 1995 2000 2005 2007<br />
<strong>World</strong> 215 585.6 272 894.8 279 923.8 255 830.7 386 403.3 525 413.0 7.5 5.5 4.4 3.7 4.0 4.4<br />
Developed economies 77 677.0 112 885.7 112 177.9 97 233.8 122 049.5 145 681.1 3.9 2.9 2.3 1.9 1.8 1.9<br />
Developing economies 104 336.1 115 161.8 155 359.5 150 929.7 248 042.7 354 478.2 16.8 14.0 11.5 9.8 9.2 9.3<br />
Africa 20 117.1 15 870.5 14 004.9 14 317.8 22 336.6 34 617.8 18.5 17.3 14.2 14.1 12.9 13.9<br />
North Africa 4 757.1 6 115.4 5 375.6 5 836.2 7 525.8 11 754.8 12.1 15.1 11.7 11.8 10.3 11.6<br />
West Africa 10 119.6 3 317.9 2 711.5 2 697.2 5 732.2 10 157.4 30.2 31.8 31.5 27.6 30.6 31.5<br />
Central Africa 1 260.3 1 458.0 1 177.8 1 058.1 1 899.6 2 589.3 22.0 24.6 25.7 20.5 16.4 15.7<br />
East Africa 1 751.2 2 796.1 2 512.9 3 030.8 4 654.8 6 630.7 37.3 40.7 36.2 34.4 33.1 32.0<br />
Southern Africa 2 228.9 2 183.1 2 227.3 1 695.5 2 524.2 3 485.6 8.7 7.8 6.9 5.9 4.6 4.5<br />
Latin America and the Caribbean 16 573.1 21 636.0 23 386.3 21 530.4 28 145.2 44 837.9 8.5 9.6 6.9 5.5 5.8 6.2<br />
South America 10 600.1 15 683.6 18 669.2 13 771.3 19 390.0 33 620.3 8.4 10.1 7.0 6.1 6.7 7.1<br />
Central America 4 850.0 4 432.5 3 839.7 6 663.3 7 620.6 9 767.7 8.9 8.5 6.8 4.8 4.6 4.6<br />
Caribbean 1 122.9 1 520.0 877.5 1 095.7 1 134.6 1 449.9 8.8 7.8 4.6 3.8 3.3 3.4<br />
Asia 67 272.5 77 235.1 117 414.2 114 662.8 197 028.2 274 435.0 21.2 15.3 13.0 11.0 9.8 9.7<br />
West Asia 4 332.2 8 903.2 10 408.8 10 075.9 12 414.4 19 378.2 6.3 11.6 10.3 8.5 5.8 5.8<br />
South, East and South-East Asia 62 940.3 68 331.9 107 005.3 104 586.9 184 613.7 255 056.8 25.2 16.0 13.3 11.4 10.2 10.2<br />
Oceania 373.4 420.1 554.1 418.8 532.7 587.5 20.1 15.4 16.3 14.7 10.8 10.1<br />
South-East Europe and the CIS 33 572.5 44 847.3 12 386.4 7 667.1 16 311.2 25 253.7 11.4 19.0 10.5 10.6 7.4 6.2<br />
South-East Europe 3 109.4 2 038.8 1 478.3 1 269.1 2 556.9 3 517.3 13.6 17.2 18.8 14.9 10.5 10.3<br />
CIS 30 463.1 42 808.5 10 908.1 6 398.0 13 754.3 21 736.3 11.2 19.1 9.9 10.0 7.1 5.8<br />
Source: UNCTAD, based on data provided by the United Nations Statistical Office.<br />
a Agriculture, hunting, forestry and fishing.<br />
Note: Gross capital formation (GCF) data were available for 10 to 30 countries only, which account for 13%–18% of total GCF. For<br />
other countries, the share of agriculture, hunting, forestry and fishing in value added was applied to total GCF to estimate GCF in<br />
agriculture.


