

World Investment Report 2009: Transnational Corporations - Unctad
World Investment Report 2009: Transnational Corporations - Unctad
World Investment Report 2009: Transnational Corporations - Unctad

Create successful ePaper yourself
Turn your PDF publications into a flip-book with our unique Google optimized e-Paper software.
220 <strong>World</strong> <strong>Investment</strong> <strong>Report</strong> <strong>2009</strong>: <strong>Transnational</strong> <strong>Corporations</strong>, Agricultural Production and Development<br />
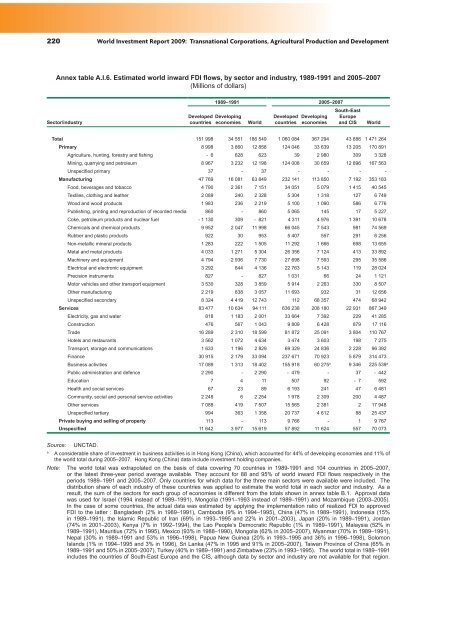
Annex table A.I.6. Estimated world inward FDI flows, by sector and industry, 1989-1991 and 2005–2007<br />
(Millions of dollars)<br />
Sector/industry<br />
Developed<br />
countries<br />
1989–1991 2005–2007<br />
Developing<br />
economies <strong>World</strong><br />
Developed<br />
countries<br />
Developing<br />
economies<br />
South-East<br />
Europe<br />
and CIS <strong>World</strong><br />
Total 151 998 34 551 186 549 1 060 084 367 294 43 886 1 471 264<br />
Primary 8 998 3 860 12 858 124 046 33 639 13 205 170 891<br />
Agriculture, hunting, forestry and fishing - 6 628 623 39 2 980 309 3 328<br />
Mining, quarrying and petroleum 8 967 3 232 12 198 124 008 30 659 12 896 167 563<br />
Unspecified primary 37 - 37 - - - -<br />
Manufacturing 47 769 16 081 63 849 232 141 113 850 7 192 353 183<br />
Food, beverages and tobacco 4 790 2 361 7 151 34 051 5 079 1 415 40 545<br />
Textiles, clothing and leather 2 089 240 2 328 5 304 1 318 127 6 749<br />
Wood and wood products 1 983 236 2 219 5 100 1 090 586 6 776<br />
Publishing, printing and reproduction of recorded media 860 - 860 5 065 145 17 5 227<br />
Coke, petroleum products and nuclear fuel - 1 130 309 - 821 4 311 4 976 1 391 10 678<br />
Chemicals and chemical products 9 952 2 047 11 998 66 045 7 543 981 74 569<br />
Rubber and plastic products 922 30 953 5 407 557 291 6 256<br />
Non-metallic mineral products 1 283 222 1 505 11 292 1 666 698 13 655<br />
Metal and metal products 4 033 1 271 5 304 26 356 7 124 413 33 892<br />
Machinery and equipment 4 794 2 936 7 730 27 698 7 593 295 35 586<br />
Electrical and electronic equipment 3 292 844 4 136 22 763 5 143 119 28 024<br />
Precision instruments 827 - 827 1 031 66 24 1 121<br />
Motor vehicles and other transport equipment 3 530 328 3 859 5 914 2 263 330 8 507<br />
Other manufacturing 2 219 838 3 057 11 693 932 31 12 656<br />
Unspecified secondary 8 324 4 419 12 743 112 68 357 474 68 942<br />
Services 83 477 10 634 94 111 636 238 208 180 22 931 867 349<br />
Electricity, gas and water 818 1 183 2 001 33 664 7 392 229 41 285<br />
Construction 476 567 1 043 9 809 6 428 879 17 116<br />
Trade 16 289 2 310 18 599 81 872 25 091 3 804 110 767<br />
Hotels and restaurants 3 562 1 072 4 634 3 474 3 603 198 7 275<br />
Transport, storage and communications 1 633 1 196 2 829 69 329 24 836 2 228 96 392<br />
Finance 30 915 2 179 33 094 237 671 70 923 5 879 314 473<br />
Business activities 17 089 1 313 18 402 155 918 60 275a 9 346 225 539a Public administration and defence 2 290 - 2 290 - 479 - 37 - 442<br />
Education 7 4 11 507 92 - 7 592<br />
Health and social services 67 23 89 6 193 241 47 6 481<br />
Community, social and personal service activities 2 248 6 2 254 1 978 2 309 200 4 487<br />
Other services 7 088 419 7 507 15 565 2 381 2 17 948<br />
Unspecified tertiary 994 363 1 358 20 737 4 612 88 25 437<br />
Private buying and selling of property 113 - 113 9 766 - 1 9 767<br />
Unspecified 11 642 3 977 15 619 57 892 11 624 557 70 073<br />
Source: UNCTAD.<br />
a A considerable share of investment in business activities is in Hong Kong (China), which accounted for 44% of developing economies and 11% of<br />
the world total during 2005–2007. Hong Kong (China) data include investment holding companies.<br />
Note: The world total was extrapolated on the basis of data covering 70 countries in 1989-1991 and 104 countries in 2005–2007,<br />
or the latest three-year period average available. They account for 88 and 95% of world inward FDI flows respectively in the<br />
periods 1989–1991 and 2005–2007. Only countries for which data for the three main sectors were available were included. The<br />
distribution share of each industry of these countries was applied to estimate the world total in each sector and industry. As a<br />
result, the sum of the sectors for each group of economies is different from the totals shown in annex table B.1. Approval data<br />
was used for Israel (1994 instead of 1989–1991), Mongolia (1991–1993 instead of 1989–1991) and Mozambique (2003–2005).<br />
In the case of some countries, the actual data was estimated by applying the implementation ratio of realized FDI to approved<br />
FDI to the latter : Bangladesh (2% in 1989–1991), Cambodia (9% in 1994–1995), China (47% in 1989–1991), Indonesia (15%<br />
in 1989–1991), the Islamic Republic of Iran (69% in 1993–1995 and 22% in 2001–2003), Japan (20% in 1989–1991), Jordan<br />
(74% in 2001–2003), Kenya (7% in 1992–1994), the Lao People’s Democratic Republic (1% in 1989–1991), Malaysia (52% in<br />
1989–1991), Mauritius (72% in 1995), Mexico (93% in 1988–1990), Mongolia (62% in 2005–2007), Myanmar (70% in 1989–1991),<br />
Nepal (30% in 1989–1991 and 53% in 1996–1998), Papua New Guinea (20% in 1993–1995 and 36% in 1996–1998), Solomon<br />
Islands (1% in 1994–1995 and 3% in 1996), Sri Lanka (47% in 1995 and 91% in 2005–2007), Taiwan Province of China (65% in<br />
1989–1991 and 50% in 2005–2007), Turkey (40% in 1989–1991) and Zimbabwe (23% in 1993–1995). The world total in 1989–1991<br />
includes the countries of South-East Europe and the CIS, although data by sector and industry are not available for that region.


