

World Investment Report 2009: Transnational Corporations - Unctad
World Investment Report 2009: Transnational Corporations - Unctad
World Investment Report 2009: Transnational Corporations - Unctad

You also want an ePaper? Increase the reach of your titles
YUMPU automatically turns print PDFs into web optimized ePapers that Google loves.
236 <strong>World</strong> <strong>Investment</strong> <strong>Report</strong> <strong>2009</strong>: <strong>Transnational</strong> <strong>Corporations</strong>, Agricultural Production and Development<br />
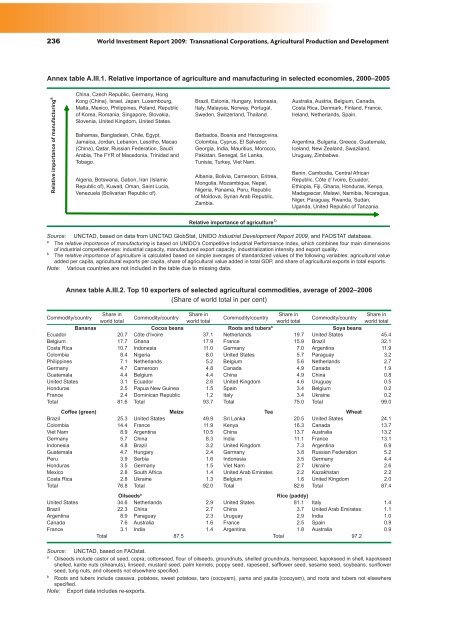
Annex table A.III.1. Relative importance of agriculture and manufacturing in selected economies, 2000–2005<br />
Relative importance of manufacturing a<br />
China, Czech Republic, Germany, Hong<br />
Kong (China), Israel, Japan, Luxembourg,<br />
Malta, Mexico, Philippines, Poland, Republic<br />
of Korea, Romania, Singapore, Slovakia,<br />
Slovenia, United Kingdom, United States.<br />
Bahamas, Bangladesh, Chile, Egypt,<br />
Jamaica, Jordan, Lebanon, Lesotho, Macao<br />
(China), Qatar, Russian Federation, Saudi<br />
Arabia, The FYR of Macedonia, Trinidad and<br />
Tobago.<br />
Algeria, Botswana, Gabon, Iran (Islamic<br />
Republic of), Kuwait, Oman, Saint Lucia,<br />
Venezuela (Bolivarian Republic of).<br />
Brazil, Estonia, Hungary, Indonesia,<br />
Italy, Malaysia, Norway, Portugal,<br />
Sweden, Switzerland, Thailand.<br />
Barbados, Bosnia and Herzegovina,<br />
Colombia, Cyprus, El Salvador,<br />
Georgia, India, Mauritius, Morocco,<br />
Pakistan, Senegal, Sri Lanka,<br />
Tunisia, Turkey, Viet Nam.<br />
Albania, Bolivia, Cameroon, Eritrea,<br />
Mongolia, Mozambique, Nepal,<br />
Nigeria, Panama, Peru, Republic<br />
of Moldova, Syrian Arab Republic,<br />
Zambia.<br />
Relative importance of agriculture b<br />
Australia, Austria, Belgium, Canada,<br />
Costa Rica, Denmark, Finland, France,<br />
Ireland, Netherlands, Spain.<br />
Argentina, Bulgaria, Greece, Guatemala,<br />
Iceland, New Zealand, Swaziland,<br />
Uruguay, Zimbabwe.<br />
Benin, Cambodia, Central African<br />
Republic, Côte d’ Ivoire, Ecuador,<br />
Ethiopia, Fiji, Ghana, Honduras, Kenya,<br />
Madagascar, Malawi, Namibia, Nicaragua,<br />
Niger, Paraguay, Rwanda, Sudan,<br />
Uganda, United Republic of Tanzania.<br />
Source: UNCTAD, based on data from UNCTAD GlobStat, UNIDO Industrial Development <strong>Report</strong> <strong>2009</strong>, and FAOSTAT database.<br />
a The relative importance of manufacturing is based on UNIDO’s Competitive Industrial Performance Index, which combines four main dimensions<br />
of industrial competitiveness: industrial capacity, manufactured export capacity, industrialization intensity and export quality.<br />
b The relative importance of agriculture is calculated based on simple averages of standardized values of the following variables: agricultural value<br />
added per capita, agricultural exports per capita, share of agricultural value added in total GDP, and share of agricultural exports in total exports.<br />
Note: Various countries are not included in the table due to missing data.<br />
Annex table A.III.2. Top 10 exporters of selected agricultural commodities, average of 2002–2006<br />
(Share of world total in per cent)<br />
Commodity/country<br />
Share in<br />
world total<br />
Commodity/country<br />
Share in<br />
world total<br />
Commodity/country<br />
Share in<br />
world total<br />
Commodity/country<br />
Share in<br />
world total<br />
Bananas Cocoa beans Roots and tubersb Soya beans<br />
Ecuador 20.7 Côte d’Ivoire 37.1 Netherlands 19.7 United States 45.4<br />
Belgium 17.7 Ghana 17.9 France 15.9 Brazil 32.1<br />
Costa Rica 10.7 Indonesia 11.0 Germany 7.0 Argentina 11.9<br />
Colombia 8.4 Nigeria 8.0 United States 5.7 Paraguay 3.2<br />
Philippines 7.1 Netherlands 5.2 Belgium 5.6 Netherlands 2.7<br />
Germany 4.7 Cameroon 4.8 Canada 4.9 Canada 1.9<br />
Guatemala 4.4 Belgium 4.4 China 4.9 China 0.8<br />
United States 3.1 Ecuador 2.6 United Kingdom 4.6 Uruguay 0.5<br />
Honduras 2.5 Papua New Guinea 1.5 Spain 3.4 Belgium 0.2<br />
France 2.4 Dominican Republic 1.2 Italy 3.4 Ukraine 0.2<br />
Total 81.6 Total 93.7 Total 75.0 Total 99.0<br />
Coffee (green) Maize Tea Wheat<br />
Brazil 25.3 United States 49.9 Sri Lanka 20.5 United States 24.1<br />
Colombia 14.4 France 11.9 Kenya 16.3 Canada 13.7<br />
Viet Nam 8.9 Argentina 10.5 China 13.7 Australia 13.2<br />
Germany 5.7 China 8.3 India 11.1 France 13.1<br />
Indonesia 4.8 Brazil 3.2 United Kingdom 7.3 Argentina 6.9<br />
Guatemala 4.7 Hungary 2.4 Germany 3.8 Russian Federation 5.2<br />
Peru 3.9 Serbia 1.6 Indonesia 3.5 Germany 4.4<br />
Honduras 3.5 Germany 1.5 Viet Nam 2.7 Ukraine 2.6<br />
Mexico 2.8 South Africa 1.4 United Arab Emirates 2.2 Kazakhstan 2.2<br />
Costa Rica 2.8 Ukraine 1.3 Belgium 1.6 United Kingdom 2.0<br />
Total 76.8 Total 92.0 Total 82.6 Total 87.4<br />
Oilseeds a Rice (paddy)<br />
United States 34.6 Netherlands 2.9 United States 81.1 Italy 1.4<br />
Brazil 22.3 China 2.7 China 3.7 United Arab Emirates 1.1<br />
Argentina 8.9 Paraguay 2.3 Uruguay 2.9 India 1.0<br />
Canada 7.6 Australia 1.6 France 2.5 Spain 0.9<br />
France 3.1 India 1.4 Argentina 1.8 Australia 0.9<br />
Total 87.5 Total 97.2<br />
Source: UNCTAD, based on FAOstat.<br />
a<br />
Oilseeds include castor oil seed, copra, cottonseed, flour of oilseeds, groundnuts, shelled groundnuts, hempseed, kapokseed in shell, kapokseed<br />
shelled, karite nuts (sheanuts), linseed, mustard seed, palm kernels, poppy seed, rapeseed, safflower seed, sesame seed, soybeans, sunflower<br />
seed, tung nuts, and oilseeds not elsewhere specified.<br />
b<br />
Roots and tubers include cassava, potatoes, sweet potatoes, taro (cocoyam), yams and yautia (cocoyam), and roots and tubers not elsewhere<br />
specified.<br />
Note: Export data includes re-exports.


