

World Investment Report 2009: Transnational Corporations - Unctad
World Investment Report 2009: Transnational Corporations - Unctad
World Investment Report 2009: Transnational Corporations - Unctad

Create successful ePaper yourself
Turn your PDF publications into a flip-book with our unique Google optimized e-Paper software.
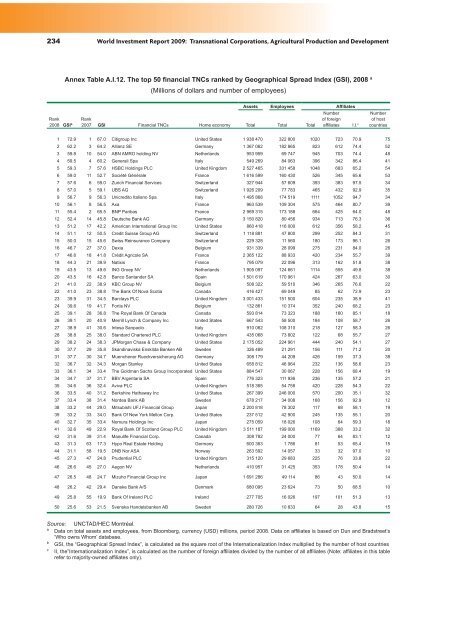
234 <strong>World</strong> <strong>Investment</strong> <strong>Report</strong> <strong>2009</strong>: <strong>Transnational</strong> <strong>Corporations</strong>, Agricultural Production and Development<br />
Rank<br />
2008 GSI b<br />
Annex Table A.I.12. The top 50 financial TNCs ranked by Geographical Spread Index (GSI), 2008 a<br />
(Millions of dollars and number of employees)<br />
Assets Employees Affiliates<br />
Rank<br />
2007 GSI Financial TNCs Home economy Total Total Total<br />
Number<br />
of foreign<br />
affiliates I.I. c<br />
Number<br />
of host<br />
countries<br />
1 72.9 1 67.0 Citigroup Inc United States 1 938 470 322 800 1020 723 70.9 75<br />
2 62.2 3 64.2 Allianz SE Germany 1 367 062 182 865 823 612 74.4 52<br />
3 59.8 10 54.0 ABN AMRO holding NV Netherlands 953 959 69 747 945 703 74.4 48<br />
4 59.5 4 60.2 Generali Spa Italy 549 269 84 063 396 342 86.4 41<br />
5 59.3 7 57.6 HSBC Holdings PLC United Kingdom 2 527 465 331 458 1048 683 65.2 54<br />
6 59.0 11 52.7 Société Générale France 1 616 599 160 430 526 345 65.6 53<br />
7 57.6 6 59.0 Zurich Financial Services Switzerland 327 944 57 609 393 383 97.5 34<br />
8 57.0 5 59.1 UBS AG Switzerland 1 926 209 77 783 465 432 92.9 35<br />
9 56.7 9 56.3 Unicredito Italiano Spa Italy 1 495 868 174 519 1111 1052 94.7 34<br />
10 56.1 8 56.5 Axa France 963 539 109 304 575 464 80.7 39<br />
11 55.4 2 65.5 BNP Paribas France 2 969 315 173 188 664 425 64.0 48<br />
12 52.4 14 45.8 Deutsche Bank AG Germany 3 150 820 80 456 934 713 76.3 36<br />
13 51.2 17 42.2 American International Group Inc United States 860 418 116 000 612 356 58.2 45<br />
14 51.1 12 50.5 Credit Suisse Group AG Switzerland 1 118 881 47 800 299 252 84.3 31<br />
15 50.0 15 45.6 Swiss Reinsurance Company Switzerland 229 328 11 560 180 173 96.1 26<br />
16 46.7 27 37.0 Dexia Belgium 931 339 28 099 275 231 84.0 26<br />
17 46.6 18 41.8 Crédit Agricole SA France 2 365 122 88 933 420 234 55.7 39<br />
18 44.3 21 39.9 Natixis France 795 079 22 096 313 162 51.8 38<br />
19 43.5 13 49.6 ING Groep NV Netherlands 1 905 097 124 661 1114 555 49.8 38<br />
20 43.5 16 42.8 Banco Santander SA Spain 1 501 619 170 961 424 267 63.0 30<br />
21 41.0 22 38.9 KBC Group NV Belgium 508 322 59 510 346 265 76.6 22<br />
22 41.0 23 38.8 The Bank Of Nova Scotia Canada 416 427 69 049 85 62 72.9 23<br />
23 39.9 31 34.5 Barclays PLC United Kingdom 3 001 433 151 500 604 235 38.9 41<br />
24 39.6 19 41.7 Fortis NV Belgium 132 861 10 374 352 240 68.2 23<br />
25 39.1 28 36.8 The Royal Bank Of Canada Canada 593 814 73 323 188 160 85.1 18<br />
26 39.1 20 40.9 Merrill Lynch & Company Inc United States 667 543 58 500 184 108 58.7 26<br />
27 38.9 41 30.6 Intesa Sanpaolo Italy 910 062 108 310 218 127 58.3 26<br />
28 38.8 25 38.0 Standard Chartered PLC United Kingdom 435 068 73 802 122 68 55.7 27<br />
29 38.2 24 38.3 JPMorgan Chase & Company United States 2 175 052 224 961 444 240 54.1 27<br />
30 37.7 29 35.8 Skandinaviska Enskilda Banken AB Sweden 326 489 21 291 156 111 71.2 20<br />
31 37.7 30 34.7 Muenchener Rueckversicherung AG Germany 308 179 44 209 426 159 37.3 38<br />
32 36.7 32 34.3 Morgan Stanley United States 658 812 46 964 232 136 58.6 23<br />
33 36.1 34 33.4 The Goldman Sachs Group Incorporated United States 884 547 30 067 228 156 68.4 19<br />
34 34.7 37 31.7 BBV Argentaria SA Spain 776 323 111 936 236 135 57.2 21<br />
35 34.6 36 32.4 Aviva PLC United Kingdom 518 365 54 758 420 228 54.3 22<br />
36 33.5 40 31.2 Berkshire Hathaway Inc United States 267 399 246 000 570 200 35.1 32<br />
37 33.4 38 31.4 Nordea Bank AB Sweden 678 217 34 008 168 156 92.9 12<br />
38 33.2 44 29.0 Mitsubishi UFJ Financial Group Japan 2 200 818 78 302 117 68 58.1 19<br />
39 33.2 33 34.0 Bank Of New York Mellon Corp. United States 237 512 42 900 245 135 55.1 20<br />
40 32.7 35 33.4 Nomura Holdings Inc Japan 275 059 18 026 108 64 59.3 18<br />
41 32.6 49 22.9 Royal Bank Of Scotland Group PLC United Kingdom 3 511 187 199 000 1169 388 33.2 32<br />
42 31.6 39 31.4 Manulife Financial Corp. Canada 308 782 24 000 77 64 83.1 12<br />
43 31.3 63 17.3 Hypo Real Estate Holding Germany 600 363 1 786 81 53 65.4 15<br />
44 31.1 58 19.5 DNB Nor ASA Norway 263 592 14 057 33 32 97.0 10<br />
45 27.3 47 24.8 Prudential PLC United Kingdom 315 120 29 683 225 76 33.8 22<br />
46 26.6 45 27.0 Aegon NV Netherlands 410 957 31 425 353 178 50.4 14<br />
47 26.5 48 24.7 Mizuho Financial Group Inc Japan 1 691 286 49 114 86 43 50.0 14<br />
48 26.2 42 29.4 Danske Bank A/S Denmark 680 095 23 624 73 50 68.5 10<br />
49 25.8 55 19.9 Bank Of Ireland PLC Ireland 277 705 16 026 197 101 51.3 13<br />
50 25.6 53 21.5 Svenska Handelsbanken AB Sweden 280 726 10 833 64 28 43.8 15<br />
Source: UNCTAD/HEC Montréal.<br />
a Data on total assets and employees, from Bloomberg, currency (USD) millions, period 2008. Data on affiliates is based on Dun and Bradstreet’s<br />
‘Who owns Whom’ database.<br />
b GSI, the “Geographical Spread Index”, is calculated as the square root of the Internationalization Index multiplied by the number of host countries<br />
c II, the”Internationalization Index”, is calculated as the number of foreign affiliates divided by the number of all affiliates (Note: affiliates in this table<br />
refer to majority-owned affiliates only).


