

World Investment Report 2009: Transnational Corporations - Unctad
World Investment Report 2009: Transnational Corporations - Unctad
World Investment Report 2009: Transnational Corporations - Unctad

Create successful ePaper yourself
Turn your PDF publications into a flip-book with our unique Google optimized e-Paper software.
CHAPTER III 117<br />
Table III.9. Inward FDI flows and stock in agriculture,<br />
selected countries, various years<br />
(Millions of dollars)<br />
Host economy<br />
Flows,<br />
average<br />
2005–2007<br />
Host economy<br />
Stock, 2007<br />
or latest year<br />
available<br />
China 747.0 China 6 156.2a Malaysia 671.2 United States 2 561.0<br />
Brazil 420.9 Viet Nam 1 753.1<br />
Russian Federation 187.7 Canada 1 497.8<br />
Indonesia 119.6 Indonesia 1 001.4a Cambodia 87.0 Russian Federation 953.0<br />
United Kingdom 84.7 Chile 949.7<br />
Poland 73.9 Italy 624.3<br />
Papua New Guinea 71.1 Australia 624.2<br />
Romania 67.7 France 616.4<br />
France 61.5 Ukraine 557.6<br />
Ukraine 57.3 Hungary 493.9<br />
Viet Nam 51.4 United Kingdom 490.8<br />
Peru 51.0 Poland 446.3<br />
Chile 49.5 Romania 412.8<br />
United Republic of<br />
Tanzania<br />
40.5 Korea, Republic of 400.5<br />
Honduras 36.2 Brazil 383.6<br />
Bulgaria 34.6 Cambodia 318.7<br />
Ecuador 31.8 Turkey 289.0<br />
Costa Rica 31.4<br />
United Republic of<br />
Tanzania<br />
252.4<br />
Source: UNCTAD, based on annex table A.III.3.<br />
a Based on approval data.<br />
Note: Data were available for a selected number of countries only<br />
(box III.5). Moreover, certain countries reported only FDI<br />
flows or FDI stock in agriculture.<br />
positions in 2007 (figure III.13). There were also<br />
six developing countries on the list – with China in<br />
third position and the Republic of Korea seventh –<br />
and one economy in transition (Croatia). Developed<br />
countries also continue to be the main home-countries<br />
of acquirers in cross-border M&As in agriculture, but<br />
since 2000, developing countries, mainly from South,<br />
East and South-East Asia as well as Latin America<br />
and the Caribbean, have been gaining in importance<br />
as sources of purchases. 32 In 2008, developing<br />
economies became major sources of cross-border<br />
take-overs, with Latin American firms this time taking<br />
the lead. 33<br />
2. Contract farming<br />
As discussed in section C, contract farming<br />
is a significant alternative to FDI in terms of TNC<br />
participation in agriculture, and there are some<br />
indications that it is growing (Da Silva, 2005). The term<br />
contract farming covers a variety of arrangements (box<br />
III.7), differing by type of contractor, type of product,<br />
intensity of coordination (usually vertical) between<br />
farmer and TNC, and number of key stakeholders<br />
involved. Five different basic models of contract<br />
farming can be distinguished: centralized, “nucleus<br />
estate”, multipartite, informal and intermediary (box<br />
III.7).<br />
TNCs in downstream stages of value chains,<br />
such as food manufacturers and retail TNCs, secure<br />
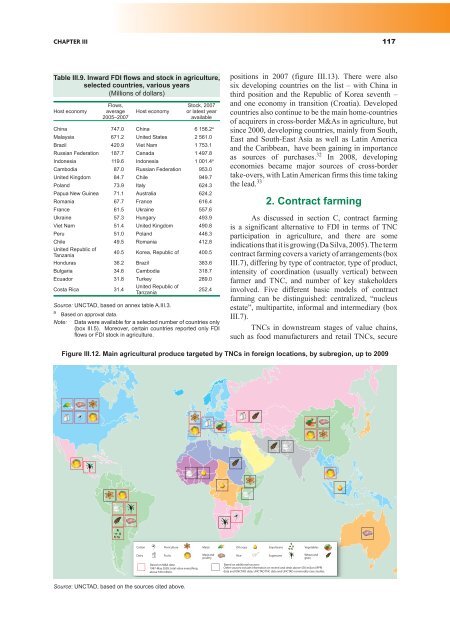
Figure III.12. Main agricultural produce targeted by TNCs in foreign locations, by subregion, up to <strong>2009</strong><br />
Cotton<br />
Dairy<br />
Floriculture<br />
Fruits<br />
Based on M&A data:<br />
1987-May <strong>2009</strong>, total value everything<br />
above $50 million.<br />
Source: UNCTAD, based on the sources cited above.<br />
Maize<br />
Meat and<br />
poultry<br />
Oil crops<br />
Soya beans<br />
Vegetables<br />
Rice<br />
Based on additional sources:<br />
Sugarcane<br />
Wheat and<br />
grain<br />
Other sources include information on recent land deals above $50 miiion (IFPRI<br />
data and UNCTAD data; UNCTAD TNC data and UNCTAD commodity case studies.


