

World Investment Report 2009: Transnational Corporations - Unctad
World Investment Report 2009: Transnational Corporations - Unctad
World Investment Report 2009: Transnational Corporations - Unctad

You also want an ePaper? Increase the reach of your titles
YUMPU automatically turns print PDFs into web optimized ePapers that Google loves.
CHAPTER III 113<br />
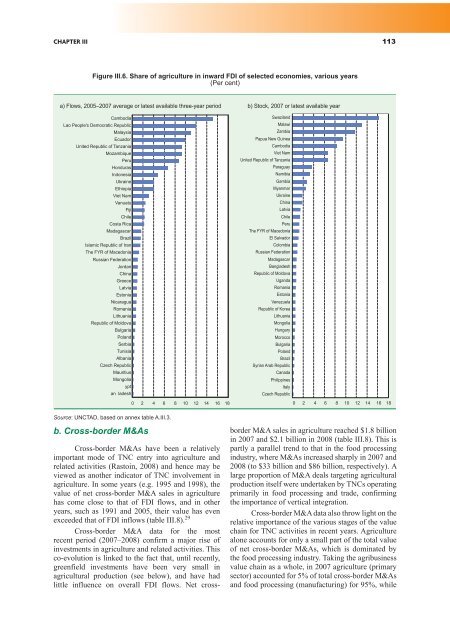
Figure III.6. Share of agriculture in inward FDI of selected economies, various years<br />
(Per cent)<br />
a) Flows, 2005–2007 average or latest available three-year period b) Stock, 2007 or latest available year<br />
Cambodia<br />
Lao People's Democratic Republic<br />
Malaysia<br />
Ecuador<br />
United Republic of Tanzania<br />
Mozambique<br />
Peru<br />
Honduras<br />
Indonesia<br />
Ukraine<br />
Ethiopia<br />
Viet Nam<br />
�������<br />
����<br />
�����<br />
����� ����<br />
����������<br />
������<br />
������� �������� �� ����<br />
��� ��� �� ���������<br />
������� ����������<br />
������<br />
�����<br />
������<br />
������<br />
�������<br />
���������<br />
�������<br />
���������<br />
�������� �� �������<br />
��������<br />
������<br />
������<br />
�������<br />
�������<br />
����� ��������<br />
���������<br />
��������<br />
�����<br />
����������<br />
Source: UNCTAD, based on annex table A.III.3.<br />
b. Cross-border M&As<br />
Cross-border M&As have been a relatively<br />
important mode of TNC entry into agriculture and<br />
related activities (Rastoin, 2008) and hence may be<br />
viewed as another indicator of TNC involvement in<br />
agriculture. In some years (e.g. 1995 and 1998), the<br />
value of net cross-border M&A sales in agriculture<br />
has come close to that of FDI flows, and in other<br />
years, such as 1991 and 2005, their value has even<br />
exceeded that of FDI inflows (table III.8). 29<br />
Cross-border M&A data for the most<br />
recent period (2007–2008) confirm a major rise of<br />
investments in agriculture and related activities. This<br />
co-evolution is linked to the fact that, until recently,<br />
greenfield investments have been very small in<br />
agricultural production (see below), and have had<br />
little influence on overall FDI flows. Net cross-<br />
Swaziland<br />
Malawi<br />
Zambia<br />
Papua New Guinea<br />
Cambodia<br />
Viet Nam<br />
United Republic of Tanzania<br />
Paraguay<br />
Namibia<br />
Gambia<br />
Myanmar<br />
Ukraine<br />
China<br />
Latvia<br />
Chile<br />
Peru<br />
The FYR of Macedonia<br />
El Salvador<br />
Colombia<br />
Russian Federation<br />
Madagascar<br />
Bangladesh<br />
Republic of Moldova<br />
Uganda<br />
Romania<br />
Estonia<br />
Venezuela<br />
Republic of Korea<br />
Lithuania<br />
Mongolia<br />
Hungary<br />
Morocco<br />
Bulgaria<br />
Poland<br />
Brazil<br />
Syrian Arab Republic<br />
Canada<br />
Philippines<br />
Italy<br />
Czech Republic<br />
0 2 4 6 8 10 12 14 16 18<br />
0 2 4 6 8 10 12 14 16 18<br />
border M&A sales in agriculture reached $1.8 billion<br />
in 2007 and $2.1 billion in 2008 (table III.8). This is<br />
partly a parallel trend to that in the food processing<br />
industry, where M&As increased sharply in 2007 and<br />
2008 (to $33 billion and $86 billion, respectively). A<br />
large proportion of M&A deals targeting agricultural<br />
production itself were undertaken by TNCs operating<br />
primarily in food processing and trade, confirming<br />
the importance of vertical integration.<br />
Cross-border M&A data also throw light on the<br />
relative importance of the various stages of the value<br />
chain for TNC activities in recent years. Agriculture<br />
alone accounts for only a small part of the total value<br />
of net cross-border M&As, which is dominated by<br />
the food processing industry. Taking the agribusiness<br />
value chain as a whole, in 2007 agriculture (primary<br />
sector) accounted for 5% of total cross-border M&As<br />
and food processing (manufacturing) for 95%, while


