

World Investment Report 2009: Transnational Corporations - Unctad
World Investment Report 2009: Transnational Corporations - Unctad
World Investment Report 2009: Transnational Corporations - Unctad

Create successful ePaper yourself
Turn your PDF publications into a flip-book with our unique Google optimized e-Paper software.
CHAPTER I 11<br />
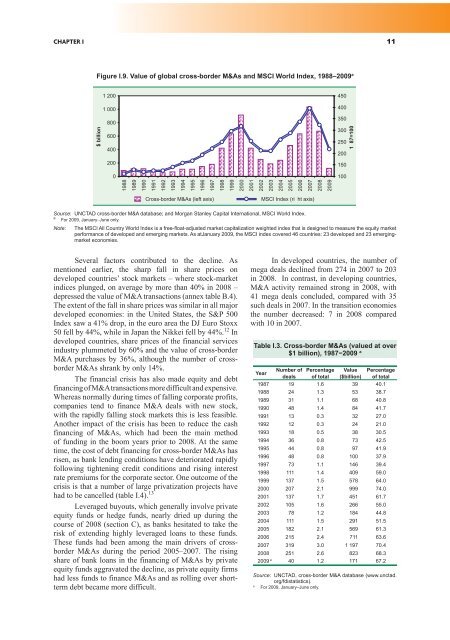
Figure I.9. Value of global cross-border M&As and MSCI <strong>World</strong> Index, 1988–<strong>2009</strong> a<br />
� �������<br />
� ���<br />
� ���<br />
���<br />
���<br />
���<br />
���<br />
�<br />
����<br />
����<br />
����<br />
����<br />
����<br />
����<br />
����<br />
������������ ���� ����� ����� ���� ����� ������ �����<br />
Source: UNCTAD cross-border M&A database; and Morgan Stanley Capital International, MSCI <strong>World</strong> Index.<br />
a<br />
For <strong>2009</strong>, January–June only.<br />
����<br />
����<br />
����<br />
����<br />
Note: The MSCI All Country <strong>World</strong> Index is a free-float-adjusted market capitalization weighted index that is designed to measure the equity market<br />
performance of developed and emerging markets. As atJanuary <strong>2009</strong>, the MSCI index covered 46 countries: 23 developed and 23 emergingmarket<br />
economies.<br />
Several factors contributed to the decline. As<br />
mentioned earlier, the sharp fall in share prices on<br />
developed countries’ stock markets – where stock-market<br />
indices plunged, on average by more than 40% in 2008 –<br />
depressed the value of M&A transactions (annex table B.4).<br />
The extent of the fall in share prices was similar in all major<br />
developed economies: in the United States, the S&P 500<br />
Index saw a 41% drop, in the euro area the DJ Euro Stoxx<br />
50 fell by 44%, while in Japan the Nikkei fell by 44%. 12 In<br />
developed countries, share prices of the financial services<br />
industry plummeted by 60% and the value of cross-border<br />
M&A purchases by 36%, although the number of crossborder<br />
M&As shrank by only 14%.<br />
The financial crisis has also made equity and debt<br />
financing of M&A transactions more difficult and expensive.<br />
Whereas normally during times of falling corporate profits,<br />
companies tend to finance M&A deals with new stock,<br />
with the rapidly falling stock markets this is less feasible.<br />
Another impact of the crisis has been to reduce the cash<br />
financing of M&As, which had been the main method<br />
of funding in the boom years prior to 2008. At the same<br />
time, the cost of debt financing for cross-border M&As has<br />
risen, as bank lending conditions have deteriorated rapidly<br />
following tightening credit conditions and rising interest<br />
rate premiums for the corporate sector. One outcome of the<br />
�������������������������������������������������������������<br />
had to be cancelled (table I.4). 13<br />
Leveraged buyouts, which generally involve private<br />
equity funds or hedge funds, nearly dried up during the<br />
course of 2008 (section C), as banks hesitated to take the<br />
risk of extending highly leveraged loans to these funds.<br />
These funds had been among the main drivers of crossborder<br />
M&As during the period 2005–2007. The rising<br />
share of bank loans in the financing of M&As by private<br />
equity funds aggravated the decline, as private equity firms<br />
had less funds to finance M&As and as rolling over shortterm<br />
debt became more difficult.<br />
����<br />
����<br />
����<br />
����<br />
����<br />
����<br />
����<br />
����<br />
����<br />
����<br />
����<br />
���<br />
���<br />
���<br />
���<br />
���<br />
���<br />
���<br />
���<br />
In developed countries, the number of<br />
mega deals declined from 274 in 2007 to 203<br />
in 2008. In contrast, in developing countries,<br />
M&A activity remained strong in 2008, with<br />
41 mega deals concluded, compared with 35<br />
such deals in 2007. In the transition economies<br />
the number decreased: 7 in 2008 compared<br />
with 10 in 2007.<br />
��������<br />
Table I.3. Cross-border M&As (valued at over<br />
����������������������� a<br />
Year<br />
Number of<br />
deals<br />
Percentage<br />
of total<br />
Value<br />
($billion)<br />
Percentage<br />
of total<br />
1987 19 1.6 39 40.1<br />
1988 24 1.3 53 38.7<br />
1989 31 1.1 68 40.8<br />
1990 48 1.4 84 41.7<br />
1991 13 0.3 32 27.0<br />
1992 12 0.3 24 21.0<br />
1993 18 0.5 38 30.5<br />
1994 36 0.8 73 42.5<br />
1995 44 0.8 97 41.9<br />
1996 48 0.8 100 37.9<br />
1997 73 1.1 146 39.4<br />
1998 111 1.4 409 59.0<br />
1999 137 1.5 578 64.0<br />
2000 207 2.1 999 74.0<br />
2001 137 1.7 451 61.7<br />
2002 105 1.6 266 55.0<br />
2003 78 1.2 184 44.8<br />
2004 111 1.5 291 51.5<br />
2005 182 2.1 569 61.3<br />
2006 215 2.4 711 63.6<br />
2007 319 3.0 1 197 70.4<br />
2008 251 2.6 823 68.3<br />
<strong>2009</strong> a 40 1.2 171 67.2<br />
Source: UNCTAD, cross-border M&A database (www.unctad.<br />
org/fdistatistics).<br />
a For <strong>2009</strong>, January–June only.


