

World Investment Report 2009: Transnational Corporations - Unctad
World Investment Report 2009: Transnational Corporations - Unctad
World Investment Report 2009: Transnational Corporations - Unctad

Create successful ePaper yourself
Turn your PDF publications into a flip-book with our unique Google optimized e-Paper software.
42 <strong>World</strong> <strong>Investment</strong> <strong>Report</strong> <strong>2009</strong>: <strong>Transnational</strong> <strong>Corporations</strong>, Agricultural Production and Development<br />
Group of economies<br />
Table II.1. Cross-border M&A sales, by sector and by groups of economies, 2007–<strong>2009</strong><br />
(Millions of dollars)<br />
All<br />
industries<br />
Primary<br />
2007 2008 <strong>2009</strong>: first half<br />
Manufacturing<br />
Services<br />
All<br />
industries<br />
Primary<br />
Manufacturing<br />
Services<br />
All<br />
industries<br />
Primary<br />
Manufacturing<br />
Services<br />
<strong>World</strong> 1 031 100 73 299 336 310 621 491 673 214 86 101 302 582 284 531 123 155 10 004 22 698 90 453<br />
Developed economies 903 430 55 806 311 264 536 360 551 847 80 514 261 139 210 194 102 313 8 294 18 967 75 051<br />
Developing economies 96 998 9 268 22 859 64 871 100 862 3 186 38 273 59 403 19 837 1 541 3 371 14 925<br />
South-East Europe<br />
and CIS (transition<br />
economies)<br />
30 671 8 225 2 187 20 259 20 505 2 401 3 169 14 934 1 005 168 360 477<br />
Source: UNCTAD cross-border M&A database (www.unctad.org/fdistatistics).<br />
A. Developing countries<br />
1. Africa<br />
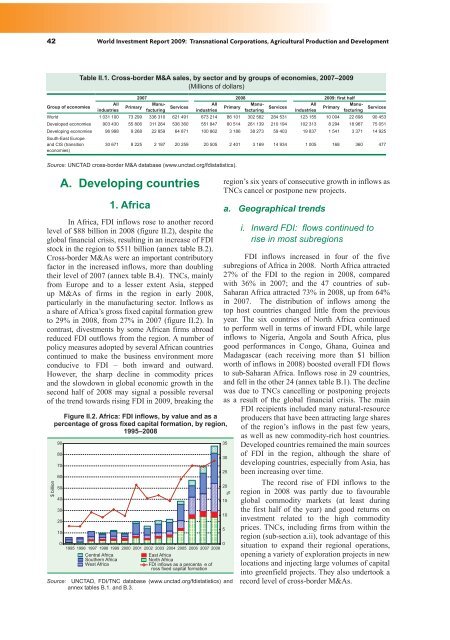
In Africa, FDI inflows rose to another record<br />
level of $88 billion in 2008 (figure II.2), despite the<br />
global financial crisis, resulting in an increase of FDI<br />
stock in the region to $511 billion (annex table B.2).<br />
Cross-border M&As were an important contributory<br />
factor in the increased inflows, more than doubling<br />
their level of 2007 (annex table B.4). TNCs, mainly<br />
from Europe and to a lesser extent Asia, stepped<br />
up M&As of firms in the region in early 2008,<br />
particularly in the manufacturing sector. Inflows as<br />
a share of Africa’s gross fixed capital formation grew<br />
to 29% in 2008, from 27% in 2007 (figure II.2). In<br />
contrast, divestments by some African firms abroad<br />
reduced FDI outflows from the region. A number of<br />
policy measures adopted by several African countries<br />
continued to make the business environment more<br />
conducive to FDI – both inward and outward.<br />
However, the sharp decline in commodity prices<br />
and the slowdown in global economic growth in the<br />
second half of 2008 may signal a possible reversal<br />
of the trend towards rising FDI in <strong>2009</strong>, breaking the<br />
� �������<br />
Figure II.2. Africa: FDI inflows, by value and as a<br />
percentage of gross fixed capital formation, by region,<br />
1995–2008<br />
��<br />
��<br />
��<br />
��<br />
��<br />
��<br />
��<br />
��<br />
��<br />
�<br />
�<br />
���� ���� ���� ���� ���� ���� ���� ���� ���� ���� ���� ���� ���� ����<br />
������� ������<br />
�������� ������<br />
���� ������<br />
���� ������<br />
����� ������<br />
��� ������� �� � ���������� ��<br />
����� ����� ������� ���������<br />
Source: UNCTAD, FDI/TNC database (www.unctad.org/fdistatistics) and<br />
annex tables B.1. and B.3.<br />
region’s six years of consecutive growth in inflows as<br />
TNCs cancel or postpone new projects.<br />
a. Geographical trends<br />
i. Inward FDI: flows continued to<br />
rise in most subregions<br />
FDI inflows increased in four of the five<br />
subregions of Africa in 2008. North Africa attracted<br />
27% of the FDI to the region in 2008, compared<br />
with 36% in 2007; and the 47 countries of sub-<br />
Saharan Africa attracted 73% in 2008, up from 64%<br />
in 2007. The distribution of inflows among the<br />
top host countries changed little from the previous<br />
year. The six countries of North Africa continued<br />
to perform well in terms of inward FDI, while large<br />
inflows to Nigeria, Angola and South Africa, plus<br />
good performances in Congo, Ghana, Guinea and<br />
Madagascar (each receiving more than $1 billion<br />
worth of inflows in 2008) boosted overall FDI flows<br />
to sub-Saharan Africa. Inflows rose in 29 countries,<br />
and fell in the other 24 (annex table B.1). The decline<br />
was due to TNCs cancelling or postponing projects<br />
as a result of the global financial crisis. The main<br />
FDI recipients included many natural-resource<br />
��<br />
��<br />
��<br />
��<br />
��<br />
��<br />
�<br />
�<br />
producers that have been attracting large shares<br />
of the region’s inflows in the past few years,<br />
as well as new commodity-rich host countries.<br />
Developed countries remained the main sources<br />
of FDI in the region, although the share of<br />
developing countries, especially from Asia, has<br />
been increasing over time.<br />
The record rise of FDI inflows to the<br />
region in 2008 was partly due to favourable<br />
global commodity markets (at least during<br />
the first half of the year) and good returns on<br />
investment related to the high commodity<br />
prices. TNCs, including firms from within the<br />
region (sub-section a.ii), took advantage of this<br />
situation to expand their regional operations,<br />
opening a variety of exploration projects in new<br />
locations and injecting large volumes of capital<br />
into greenfield projects. They also undertook a<br />
record level of cross-border M&As.


