

World Investment Report 2009: Transnational Corporations - Unctad
World Investment Report 2009: Transnational Corporations - Unctad
World Investment Report 2009: Transnational Corporations - Unctad

Create successful ePaper yourself
Turn your PDF publications into a flip-book with our unique Google optimized e-Paper software.
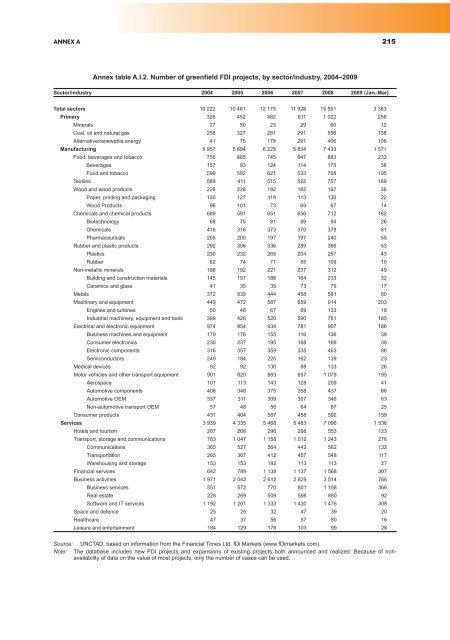
ANNEX A 215<br />
Annex table A.I.2. Number of greenfield FDI projects, by sector/industry, 2004–<strong>2009</strong><br />
Sector/industry 2004 2005 2006 2007 2008 <strong>2009</strong> (Jan–Mar)<br />
Total sectors 10 222 10 481 12 175 11 928 15 551 3 363<br />
Primary 326 452 482 611 1 022 256<br />
Minerals 27 50 23 29 60 12<br />
Coal, oil and natural gas 258 327 281 291 556 138<br />
Alternative/renewable energy 41 75 178 291 406 106<br />
Manufacturing 5 957 5 694 6 225 5 834 7 433 1 571<br />
Food, beverages and tobacco 756 685 745 647 883 233<br />
Beverages 157 93 124 114 175 38<br />
Food and tobacco 599 592 621 533 708 195<br />
Textiles 589 411 515 522 757 189<br />
Wood and wood products 226 228 192 182 197 36<br />
Paper, printing and packaging 130 127 119 113 130 22<br />
Wood Products 96 101 73 69 67 14<br />
Chemicals and chemical products 689 591 651 656 712 162<br />
Biotechnology 68 75 81 89 94 26<br />
Chemicals 416 316 373 370 378 81<br />
Pharmaceuticals 205 200 197 197 240 55<br />
Rubber and plastic products 292 306 336 289 366 53<br />
Plastics 230 232 265 204 257 43<br />
Rubber 62 74 71 85 109 10<br />
Non-metallic minerals 186 192 221 237 312 49<br />
Building and construction materials 145 157 186 164 233 32<br />
Ceramics and glass 41 35 35 73 79 17<br />
Metals 372 539 444 458 581 80<br />
Machinery and equipment 449 472 587 659 914 203<br />
Engines and turbines 50 46 67 69 133 18<br />
Industrial machinery, equipment and tools 399 426 520 590 781 185<br />
Electrical and electronic equipment 974 954 934 781 907 186<br />
Business machines and equipment 179 176 155 116 136 39<br />
Consumer electronics 230 237 195 168 169 38<br />
Electronic components 316 357 359 335 463 86<br />
Semiconductors 249 184 225 162 139 23<br />
Medical devices 92 92 130 88 133 26<br />
Motor vehicles and other transport equipment 901 820 883 857 1 079 195<br />
Aerospace 101 113 143 128 209 41<br />
Automotive components 406 348 375 358 437 66<br />
Automotive OEM 337 311 309 307 346 63<br />
Non-automotive transport OEM 57 48 56 64 87 25<br />
Consumer products 431 404 587 458 592 159<br />
Services 3 939 4 335 5 468 5 483 7 096 1 536<br />
Hotels and tourism 287 266 296 298 553 123<br />
Transport, storage and communications 783 1 047 1 158 1 012 1 243 276<br />
Communications 365 527 564 442 582 132<br />
Transportation 265 367 412 457 548 117<br />
Warehousing and storage 153 153 182 113 113 27<br />
Financial services 642 789 1 138 1 137 1 568 307<br />
Business activities 1 971 2 042 2 612 2 829 3 514 766<br />
Business services 551 572 770 801 1 158 366<br />
Real estate 228 269 509 598 880 92<br />
Software and IT services 1 192 1 201 1 333 1 430 1 476 308<br />
Space and defence 25 25 32 47 39 20<br />
Healthcare 47 37 56 57 80 16<br />
Leisure and entertainment 184 129 176 103 99 28<br />
Source: UNCTAD, based on information from the Financial Times Ltd, fDi Markets (www.fDimarkets.com).<br />
Note: The database includes new FDI projects and expansions of existing projects both announced and realized. Because of nonavailability<br />
of data on the value of most projects, only the number of cases can be used.


