

World Investment Report 2009: Transnational Corporations - Unctad
World Investment Report 2009: Transnational Corporations - Unctad
World Investment Report 2009: Transnational Corporations - Unctad

You also want an ePaper? Increase the reach of your titles
YUMPU automatically turns print PDFs into web optimized ePapers that Google loves.
274 <strong>World</strong> <strong>Investment</strong> <strong>Report</strong> <strong>2009</strong>: <strong>Transnational</strong> <strong>Corporations</strong>, Agricultural Production and Development<br />
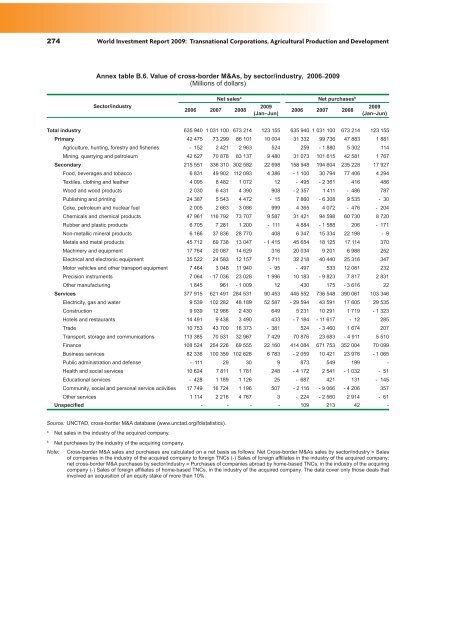
Annex table B.6. Value of cross-border M&As, by sector/industry, 2006�<strong>2009</strong><br />
(Millions of dollars)<br />
Sector/industry<br />
2006 2007 ����<br />
Net sales a Net purchases b<br />
<strong>2009</strong><br />
���������<br />
2006 2007 ����<br />
<strong>2009</strong><br />
���������<br />
Total industry 635 940 1 031 100 673 214 123 155 635 940 1 031 100 673 214 123 155<br />
Primary 42 475 73 299 86 101 10 004 31 332 99 736 47 883 1 881<br />
Agriculture, hunting, forestry and fisheries - 152 2 421 2 963 524 259 - 1 880 5 302 114<br />
Mining, quarrying and petroleum 42 627 70 878 83 137 9 480 31 073 101 615 42 581 1 767<br />
Secondary 215 551 336 310 302 582 22 698 158 948 194 604 235 228 17 927<br />
Food, beverages and tobacco 6 831 49 902 112 093 4 386 - 1 100 30 794 77 406 4 294<br />
Textiles, clothing and leather 4 095 8 482 1 072 12 - 495 - 2 361 416 486<br />
Wood and wood products 2 030 6 431 4 390 908 - 2 357 1 411 - 486 787<br />
Publishing and printing 24 387 5 543 4 472 - 15 7 860 - 6 308 9 535 - 30<br />
Coke, petroleum and nuclear fuel 2 005 2 663 3 086 999 4 365 4 072 - 476 - 204<br />
Chemicals and chemical products 47 961 116 792 73 707 9 587 31 421 94 598 60 730 8 720<br />
Rubber and plastic products 6 705 7 281 1 200 - 111 4 884 - 1 588 206 - 171<br />
Non-metallic mineral products 6 166 37 836 28 770 408 6 347 15 334 22 198 - 9<br />
Metals and metal products 45 712 69 738 13 047 - 1 415 45 654 18 125 17 114 370<br />
Machinery and equipment 17 764 20 087 14 629 316 20 034 9 201 6 988 252<br />
Electrical and electronic equipment 35 522 24 583 12 157 5 711 32 218 40 440 25 316 347<br />
Motor vehicles and other transport equipment 7 464 3 048 11 940 - 95 - 497 533 12 081 232<br />
Precision instruments 7 064 - 17 036 23 028 1 996 10 183 - 9 823 7 817 2 831<br />
Other manufacturing 1 845 961 - 1 009 12 430 175 - 3 616 22<br />
Services 377 915 621 491 284 531 90 453 445 552 736 548 390 061 103 346<br />
Electricity, gas and water 9 539 102 282 48 189 52 587 - 29 594 43 591 17 605 29 535<br />
Construction 9 939 12 986 2 430 649 5 231 10 291 1 719 - 1 323<br />
Hotels and restaurants 14 491 9 438 3 490 433 - 7 184 - 11 617 - 12 285<br />
Trade 10 753 43 700 16 373 - 381 524 - 3 460 1 674 207<br />
Transport, storage and communications 113 385 70 531 32 967 7 429 70 876 23 683 - 4 911 5 510<br />
Finance 108 524 254 226 69 555 22 160 414 084 671 753 352 004 70 099<br />
Business services 82 336 100 359 102 628 6 783 - 2 059 10 421 23 976 - 1 065<br />
Public administration and defense - 111 29 30 9 873 549 199 -<br />
Health and social services 10 624 7 811 1 781 248 - 4 172 2 541 - 1 032 - 51<br />
Educational services - 428 1 189 1 126 25 - 687 421 131 - 145<br />
Community, social and personal service activities 17 749 16 724 1 196 507 - 2 116 - 9 066 - 4 206 357<br />
Other services 1 114 2 216 4 767 3 - 224 - 2 560 2 914 - 61<br />
Unspecified - - - - 109 213 42 -<br />
Source: UNCTAD, cross-border M&A database (www.unctad.org/fdistatistics).<br />
a Net sales in the industry of the acquired company.<br />
b Net purchases by the industry of the acquiring company.<br />
Note: Cross-border M&A sales and purchases are calculated on a net basis as follows: Net Cross-border M&As sales by sector/industry = Sales<br />
of companies in the industry of the acquired company to foreign TNCs (-) Sales of foreign affiliates in the industry of the acquired company;<br />
net cross-border M&A purchases by sector/industry = Purchases of companies abroad by home-based TNCs, in the industry of the acquiring<br />
company (-) Sales of foreign affiliates of home-based TNCs, in the industry of the acquired company. The data cover only those deals that<br />
involved an acquisition of an equity stake of more than 10%.


