

World Investment Report 2009: Transnational Corporations - Unctad
World Investment Report 2009: Transnational Corporations - Unctad
World Investment Report 2009: Transnational Corporations - Unctad

You also want an ePaper? Increase the reach of your titles
YUMPU automatically turns print PDFs into web optimized ePapers that Google loves.
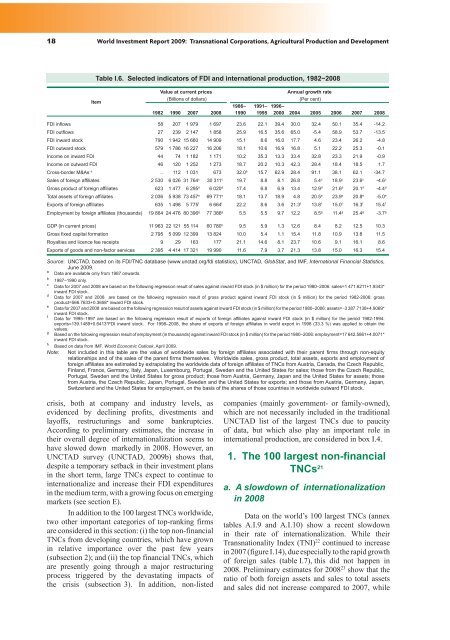
18 <strong>World</strong> <strong>Investment</strong> <strong>Report</strong> <strong>2009</strong>: <strong>Transnational</strong> <strong>Corporations</strong>, Agricultural Production and Development<br />
������������������������������������������������������������������������������<br />
Item<br />
Value at current prices Annual growth rate<br />
(Billions of dollars) (Per cent)<br />
1982 1990 2007 2008<br />
1986–<br />
1990<br />
1991– 1996–<br />
1995 2000 2004 2005 2006 2007 2008<br />
FDI inflows 58 207 1 979 1 697 23.6 22.1 39.4 30.0 32.4 50.1 35.4 -14.2<br />
FDI outflows 27 239 2 147 1 858 25.9 16.5 35.6 65.0 -5.4 58.9 53.7 -13.5<br />
FDI inward stock 790 1 942 15 660 14 909 15.1 8.6 16.0 17.7 4.6 23.4 26.2 -4.8<br />
FDI outward stock 579 1 786 16 227 16 206 18.1 10.6 16.9 16.8 5.1 22.2 25.3 -0.1<br />
Income on inward FDI 44 74 1 182 1 171 10.2 35.3 13.3 33.4 32.8 23.3 21.9 -0.9<br />
Income on outward FDI 46 120 1 252 1 273 18.7 20.2 10.3 42.3 28.4 18.4 18.5 1.7<br />
Cross-border M&As a .. 112 1 031 673 32.0b 15.7 62.9 28.4 91.1 38.1 62.1 -34.7<br />
Sales of foreign affiliates 2 530 6 026 31 764c 30 311c 19.7 8.8 8.1 26.8 5.4c 18.9c 23.6c -4.6c Gross product of foreign affiliates 623 1 477 6 295d 6 020d 17.4 6.8 6.9 13.4 12.9d 21.6d 20.1d -4.4d Total assets of foreign affiliates 2 036 5 938 73 457e 69 771e 18.1 13.7 18.9 4.8 20.5e 23.9e 20.8e -5.0e Exports of foreign affiliates 635 1 498 5 775f 6 664f 22.2 8.6 3.6 21.3f 13.8f 15.0f 16.3f 15.4f Employment by foreign affiliates (thousands) 19 864 24 476 80 396g 77 386g 5.5 5.5 9.7 12.2 8.5g 11.4g 25.4g -3.7g GDP (in current prices) 11 963 22 121 55 114 60 780h 9.5 5.9 1.3 12.6 8.4 8.2 12.5 10.3<br />
Gross fixed capital formation 2 795 5 099 12 399 13 824 10.0 5.4 1.1 15.4 11.8 10.9 13.8 11.5<br />
Royalties and licence fee receipts 9 29 163 177 21.1 14.6 8.1 23.7 10.6 9.1 16.1 8.6<br />
Exports of goods and non-factor services 2 395 4 414 17 321 19 990 11.6 7.9 3.7 21.3 13.8 15.0 16.3 15.4<br />
Source: UNCTAD, based on its FDI/TNC database (www.unctad.org/fdi statistics), UNCTAD, GlobStat, and IMF, International Financial Statistics,<br />
June <strong>2009</strong>.<br />
a<br />
Data are available only from 1987 onwards.<br />
b<br />
1987–1990 only.<br />
c<br />
Data for 2007 and 2008 are based on the following regression result of sales against inward FDI stock (in $ million) for the period 1980–2006: sales=1 471.6211+1.9343*<br />
inward FDI stock.<br />
d<br />
Data for 2007 and 2008 are based on the following regression result of gross product against inward FDI stock (in $ million) for the period 1982-2006: gross<br />
product=566.7633+0.3658* inward FDI stock.<br />
e<br />
Data for 2007 and 2008 are based on the following regression result of assets against inward FDI stock (in $ million) for the period 1980–2006: assets= -3 387.7138+4.9069*<br />
inward FDI stock.<br />
f<br />
Data for 1995–1997 are based on the following regression result of exports of foreign affiliates against inward FDI stock (in $ million) for the period 1982-1994:<br />
exports=139.1489+0.6413*FDI inward stock. For 1998–2008, the share of exports of foreign affiliates in world export in 1998 (33.3 %) was applied to obtain the<br />
values.<br />
g<br />
Based on the following regression result of employment (in thousands) against inward FDI stock (in $ million) for the period 1980–2006: employment=17 642.5861+4.0071*<br />
inward FDI stock.<br />
h<br />
Based on data from IMF, <strong>World</strong> Economic Outlook, April <strong>2009</strong>.<br />
Note: Not included in this table are the value of worldwide sales by foreign affiliates associated with their parent firms through non-equity<br />
relationships and of the sales of the parent firms themselves. <strong>World</strong>wide sales, gross product, total assets, exports and employment of<br />
foreign affiliates are estimated by extrapolating the worldwide data of foreign affiliates of TNCs from Austria, Canada, the Czech Republic,<br />
Finland, France, Germany, Italy, Japan, Luxembourg, Portugal, Sweden and the United States for sales; those from the Czech Republic,<br />
Portugal, Sweden and the United States for gross product; those from Austria, Germany, Japan and the United States for assets; those<br />
from Austria, the Czech Republic, Japan, Portugal, Sweden and the United States for exports; and those from Austria, Germany, Japan,<br />
Switzerland and the United States for employment, on the basis of the shares of those countries in worldwide outward FDI stock.<br />
crisis, both at company and industry levels, as<br />
evidenced by declining profits, divestments and<br />
layoffs, restructurings and some bankruptcies.<br />
According to preliminary estimates, the increase in<br />
������������������������������������������������������<br />
have slowed down markedly in 2008. However, an<br />
UNCTAD survey (UNCTAD, <strong>2009</strong>b) shows that,<br />
despite a temporary setback in their investment plans<br />
in the short term, large TNCs expect to continue to<br />
����������������������������������������������������������<br />
in the medium term, with a growing focus on emerging<br />
markets (see section E).<br />
In addition to the 100 largest TNCs worldwide,<br />
two other important categories of top-ranking firms<br />
are considered in this section: (i) the top non-financial<br />
TNCs from developing countries, which have grown<br />
in relative importance over the past few years<br />
(subsection 2); and (ii) the top financial TNCs, which<br />
are presently going through a major restructuring<br />
process triggered by the devastating impacts of<br />
the crisis (subsection 3). In addition, non-listed<br />
companies (mainly government- or family-owned),<br />
which are not necessarily included in the traditional<br />
UNCTAD list of the largest TNCs due to paucity<br />
of data, but which also play an important role in<br />
international production, are considered in box I.4.<br />
1. The 100 largest non-financial<br />
TNCs 21<br />
a. A slowdown of internationalization<br />
in 2008<br />
Data on the world’s 100 largest TNCs (annex<br />
tables A.I.9 and A.I.10) show a recent slowdown<br />
��� ������ ����� ��� ���������������������� ������ ������<br />
<strong>Transnational</strong>ity Index (TNI) 22 continued to increase<br />
in 2007 (figure I.14), due especially to the rapid growth<br />
of foreign sales (table I.7), this did not happen in<br />
2008. Preliminary estimates for 2008 23 show that the<br />
ratio of both foreign assets and sales to total assets<br />
and sales did not increase compared to 2007, while


