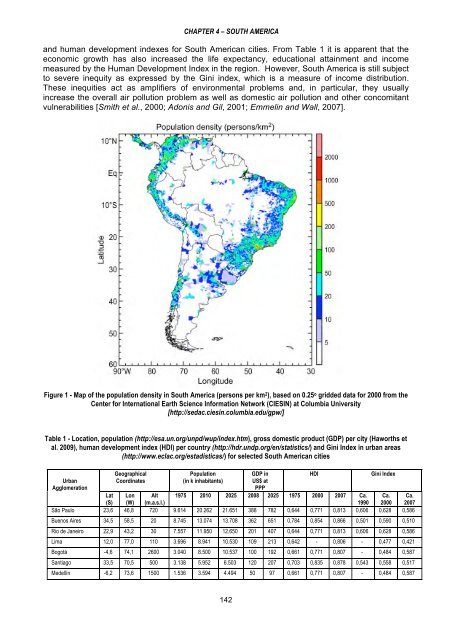
CHAPTER 4 – SOUTH AMERICAand human development indexes for South American cities. From Table 1 it is apparent that theeconomic growth has also increased the life expectancy, educational attainment and incomemeasured by the Human Development Index in the region. However, South America is still subjectto severe inequity as expressed by the Gini index, which is a measure of income distribution.These inequities act as amplifiers of environmental problems and, in particular, they usuallyincrease the overall air pollution problem as well as domestic air pollution and other concomitantvulnerabilities [Smith et al., 2000; Adonis and Gil, 2001; Emmelin and Wall, 2007].Figure 1 - Map of the population density in South America (persons per km 2 ), based on 0.25 o gridded data for 2000 from theCenter for International Earth Science Information Network (CIESIN) at Columbia University[http://sedac.ciesin.columbia.edu/gpw/]Table 1 - Location, population (http://esa.un.org/unpd/wup/index.htm), gross domestic product (GDP) per city (Haworths etal. 2009), human development index (HDI) per country (http://hdr.undp.org/en/statistics/) and Gini Index in urban areas(http://www.eclac.org/estadisticas/) for selected South American citiesUrbanAgglomerationGeographicalCoordinatesPopulation(in k inhabitants)GDP inUS$ atPPPHDIGini IndexLat Lon Alt 1975 2010 2025 2008 2025 1975 2000 2007 Ca. Ca. Ca.(S) (W) (m.a.s.l.)1990 2000 2007São Paulo 23,6 46,8 720 9.614 20.262 21.651 388 782 0,644 0,771 0,813 0,606 0,628 0,586Buenos Aires 34,5 58,5 20 8.745 13.074 13.708 362 651 0,784 0,854 0,866 0,501 0,590 0,510Rio de Janeiro 22,9 43,2 30 7.557 11.950 12.650 201 407 0,644 0,771 0,813 0,606 0,628 0,586Lima 12,0 77,0 110 3.696 8.941 10.530 109 213 0,642 - 0,806 - 0,477 0,421Bogotá -4,6 74,1 2600 3.040 8.500 10.537 100 192 0,661 0,771 0,807 - 0,484 0,587Santiago 33,5 70,5 500 3.138 5.952 6.503 120 207 0,703 0,835 0,878 0,543 0,558 0,517Medellín -6,2 73,6 1500 1.536 3.594 4.494 50 97 0,661 0,771 0,807 - 0,484 0,587142
Typically, air pollution research and management initiatives have been triggered by severeproblems. Therefore, emphasis has been put on short-term and local-scale analyses designed todeal with acute problems, i.e., extreme pollution events, whereas little attention has been paid tolong-term, large-scale effects. This is slowly starting to change in places where environmentalgoals have become more ambitious (e.g., Santiago, São Paulo). It is encouraging to see that themajority of the environmental authorities in the region (Brazil, Chile, Colombia, Peru, etc.) haveadopted in principle the Internet as a tool for publishing data, assessments, and procedures. Inpractice, however, one often finds inconsistencies and information gaps.A summary of the situation in different urban agglomerations in South America is givenhere. The following section addresses crosscutting issues related to modelling, emissions,monitoring, and regulation. In addition, we look at the continent as a whole looking at the impact ofnon-urban sources on megacities and the footprints of megacities. We then describe the situationin Bogotá and Medellín in Colombia, Buenos Aires in Argentina, Lima in Peru, Santiago in Chile,and Rio de Janeiro and São Paulo in Brazil. In all of these cities, except in Buenos Aires, there isconcern about air quality, systematic air quality monitoring, and attainment plans have alreadybeen implemented. This review is to be considered illustrative, not comprehensive, of the presentsituation in South American megapolis by showing specific characteristics and features as well asthe differences across cities and countries. The review considers relatively smaller cities that areexpected to grow and that already show significant pollution levels (e.g., Medellín), medium-sizecapitals with heavy air pollution (e.g., Bogotá, Santiago, Lima), and cities that already surpassed10 million inhabitants (Buenos Aires, São Paulo and Rio de Janeiro).4.1.1 ModellingDispersion modelling, and its operational implementation “chemical weather forecasting”, isa key-tool for dealing with air quality problems. There is an increasing number of groups in SouthAmerica developing and applying air quality models [Andrade et al., 2004; Freitas et al., 2005a;Freitas et al., 2005b; Martins and Andrade, 2008a; e.g., Gallardo et al., 2002; Olivares et al., 2002;Schmitz, 2005; Saide et al., 2009a; Jorquera and Castro, 2009; Freitas et al., 2009; Longo et al.,2010; Saide et al., 2011a, etc.]. Several institutions, including research centres, environmentalauthorities, and weather services (See Table 2) have implemented operational chemical weatherforecasting systems. Inverse modelling is also being used [Hoelzemann et al., 2009; Saide et al.,2009a; Jorquera and Castro, 2010; Saide et al., 2011b]. Further, fast Internet connections arealready available (http://www.redclara.net/) making it possible to develop grid-computingapplications, particularly within the framework of atmospheric physical and chemical weatherforecasting [D’Almeida et al, 2008].Table 2 - Examples of operational Chemical Weather Forecasting Systems at the urban and continental scalein South AmericaInstitution responsible Coverage SpeciesforecastedBrazilian Center for Continental Criteria pollutantsWeather Forecast andand AOD fromClimate (INPE/CPTEC)biomass burningAtmospheric SciencesDepartment, University ofSão PauloDirección Meteorológicade Chile (DMC, ChileanWeather Office)Dirección del ÁreaMetropolitana del Valle deAburráSão Paulo andsurroundingareasCriteria pollutantsInternethttp://www.cptec.inpe.br/meio_ambiente/http://www.master.iag.usp.brSantiago Ozone http://www.meteochile.cl/modeloPOLYPHEMUSozono.htmlMedellín Criteria pollutants http://www.metropol.gov.co/aire/143
- Page 2:
© World Meteorological Organizatio
- Page 8 and 9:
The second lead authors meeting was
- Page 12 and 13:
CHAPTER 1 - INTRODUCTIONatmospheric
- Page 14 and 15:
CHAPTER 1 - INTRODUCTIONThe impact
- Page 16 and 17:
CHAPTER 1 - INTRODUCTIONEquations 1
- Page 18 and 19:
CHAPTER 1 - INTRODUCTIONThere is a
- Page 20 and 21:
CHAPTER 1 - INTRODUCTIONFigure 8 -
- Page 22 and 23:
CHAPTER 1 - INTRODUCTIONLow-income
- Page 24 and 25:
CHAPTER 1 - INTRODUCTION1.5 SCIENTI
- Page 26 and 27:
CHAPTER 1 - INTRODUCTIONFigure 12 -
- Page 28 and 29:
CHAPTER 1 - INTRODUCTIONthese aeros
- Page 30 and 31:
CHAPTER 1 - INTRODUCTIONFigure 16:
- Page 32 and 33:
CHAPTER 1 - INTRODUCTIONFigure 18 -
- Page 34 and 35:
CHAPTER 1 - INTRODUCTIONReferencesA
- Page 36 and 37:
CHAPTER 1 - INTRODUCTIONLeibensperg
- Page 38 and 39:
CHAPTER 2 - AFRICACoordinating auth
- Page 40 and 41:
CHAPTER 2 - AFRICAFigure 3 displays
- Page 42 and 43:
CHAPTER 2 - AFRICAabout 2,000 mm pe
- Page 44 and 45:
CHAPTER 2 - AFRICAFigure 5 - NO2 me
- Page 46 and 47:
CHAPTER 2 - AFRICAIn West-African c
- Page 48 and 49:
CHAPTER 2 - AFRICAratios in Bamako
- Page 50 and 51:
CHAPTER 2 - AFRICAAs shown in Figur
- Page 52 and 53:
CHAPTER 2 - AFRICAof the city of Jo
- Page 54 and 55:
CHAPTER 2 - AFRICAlow smoke coal wa
- Page 56 and 57:
CHAPTER 2 - AFRICAcompleted, their
- Page 58 and 59:
CHAPTER 2 - AFRICAepidemiological d
- Page 60 and 61:
CHAPTER 2 - AFRICAPopulationGrowthR
- Page 62 and 63:
CHAPTER 2 - AFRICAcycle with levels
- Page 64 and 65:
CHAPTER 2 - AFRICAcomparable to tho
- Page 66 and 67:
CHAPTER 2 - AFRICAFavez, O., Sciare
- Page 68 and 69:
CHAPTER 2 - AFRICASeagrave, J., McD
- Page 70 and 71:
CHAPTER 3 - ASIAThe bottom-up and t
- Page 72 and 73:
CHAPTER 3 - ASIAFigure 2 - (a) CO e
- Page 74 and 75:
CHAPTER 3 - ASIAand Kim Oanh, 2002]
- Page 76 and 77:
CHAPTER 3 - ASIAFigure 4 - Annual a
- Page 78 and 79:
CHAPTER 3 - ASIAmaintenance program
- Page 80 and 81:
CHAPTER 3 - ASIAnearly half of the
- Page 82 and 83:
CHAPTER 3 - ASIARelationships of th
- Page 84 and 85:
CHAPTER 3 - ASIAFigure 12 - Graphic
- Page 86 and 87:
CHAPTER 3 - ASIAAnother significant
- Page 88 and 89:
CHAPTER 3 - ASIAand international),
- Page 90 and 91:
CHAPTER 3 - ASIAFigure 17 - (a) Var
- Page 92 and 93:
CHAPTER 3 - ASIAEmissions inventory
- Page 94 and 95:
CHAPTER 3 - ASIAAir Quality Index r
- Page 96 and 97:
CHAPTER 3 - ASIA• Strict restrict
- Page 98 and 99:
CHAPTER 3 - ASIAis due the ban of l
- Page 100 and 101:
CHAPTER 3 - ASIAAvailability of air
- Page 102 and 103: CHAPTER 3 - ASIAFigure 26 - Box plo
- Page 104 and 105: CHAPTER 3 - ASIAResearch projects o
- Page 106 and 107: CHAPTER 3 - ASIAmonitoring stations
- Page 108 and 109: CHAPTER 3 - ASIApreliminary stage.
- Page 110 and 111: CHAPTER 3 - ASIATable 8 - National
- Page 112 and 113: CHAPTER 3 - ASIAControl strategiesA
- Page 114 and 115: CHAPTER 3 - ASIAMetro Manila Air Qu
- Page 116 and 117: CHAPTER 3 - ASIAmoves inland and O
- Page 118 and 119: CHAPTER 3 - ASIAHong Kong and Macau
- Page 120 and 121: CHAPTER 3 - ASIAFigure 39 - A 52-ye
- Page 122 and 123: CHAPTER 3 - ASIAClimatic change iss
- Page 124 and 125: CHAPTER 3 - ASIAEmission sources of
- Page 126 and 127: CHAPTER 3 - ASIAIn the case of PM 1
- Page 128 and 129: CHAPTER 3 - ASIAdue to yellow sand
- Page 130 and 131: CHAPTER 3 - ASIAEmission inventorie
- Page 132 and 133: CHAPTER 3 - ASIAatmosphere, which i
- Page 134 and 135: CHAPTER 3 - ASIAEmissions of NO X f
- Page 136 and 137: CHAPTER 3 - ASIAFigure 58 - Annuall
- Page 138 and 139: CHAPTER 3 - ASIAThe predominance of
- Page 140 and 141: CHAPTER 3 - ASIAthe negative health
- Page 142 and 143: CHAPTER 3 - ASIAAsrari, E., Ghole,
- Page 144 and 145: CHAPTER 3 - ASIAGuo H, Fine AJ, So
- Page 146 and 147: CHAPTER 3 - ASIALi L., Chen C.H., H
- Page 148 and 149: CHAPTER 3 - ASIAPollution Control D
- Page 150 and 151: CHAPTER 3 - ASIAYu JZ, Tung JWT, Wu
- Page 154 and 155: CHAPTER 4 - SOUTH AMERICA4.1.2 Emis
- Page 156 and 157: CHAPTER 4 - SOUTH AMERICATable 4 -
- Page 158 and 159: CHAPTER 4 - SOUTH AMERICAemissions
- Page 160 and 161: CHAPTER 4 - SOUTH AMERICAthird moun
- Page 162 and 163: 4.3 BUENOS AIRES, ARGENTINACHAPTER
- Page 164 and 165: CHAPTER 4 - SOUTH AMERICAless than
- Page 166 and 167: CHAPTER 4 - SOUTH AMERICApart of Sa
- Page 168 and 169: CHAPTER 4 - SOUTH AMERICAThe Nation
- Page 170 and 171: CHAPTER 4 - SOUTH AMERICA4.7 SÃO P
- Page 172 and 173: CHAPTER 4 - SOUTH AMERICAhydrocarbo
- Page 174 and 175: CHAPTER 4 - SOUTH AMERICAthat such
- Page 176 and 177: CHAPTER 4 - SOUTH AMERICACorvalán,
- Page 178 and 179: CHAPTER 4 - SOUTH AMERICALongo, K.
- Page 180 and 181: CHAPTER 4 - SOUTH AMERICARomero Lan
- Page 182 and 183: CHAPTER 5 - NORTH AMERICACoordinati
- Page 184 and 185: CHAPTER 5 - NORTH AMERICAstories fo
- Page 186 and 187: CHAPTER 5 - NORTH AMERICAthat impro
- Page 188 and 189: CHAPTER 5 - NORTH AMERICA5.2 THE US
- Page 190 and 191: CHAPTER 5 - NORTH AMERICAcontributi
- Page 192 and 193: CHAPTER 5 - NORTH AMERICAseason fro
- Page 194 and 195: CHAPTER 5 - NORTH AMERICAtoluene, a
- Page 196 and 197: CHAPTER 5 - NORTH AMERICAand small
- Page 198 and 199: CHAPTER 5 - NORTH AMERICABlumenthal
- Page 200 and 201: CHAPTER 5 - NORTH AMERICALei, W., Z
- Page 202 and 203:
CHAPTER 5 - NORTH AMERICAVelasco, E
- Page 204 and 205:
CHAPTER 6 - EUROPEFigure 1 shows a
- Page 206 and 207:
CHAPTER 6 - EUROPE6.1.3 Pollution l
- Page 208 and 209:
CHAPTER 6 - EUROPEFigure 4 - [Carsl
- Page 210 and 211:
CHAPTER 6 - EUROPEFigure 7 - Greate
- Page 212 and 213:
CHAPTER 6 - EUROPEFigure 9 - Partit
- Page 214 and 215:
CHAPTER 6 - EUROPEFrom a regulatory
- Page 216 and 217:
CHAPTER 6 - EUROPEB) Particulate ma
- Page 218 and 219:
CHAPTER 6 - EUROPE• During the wi
- Page 220 and 221:
CHAPTER 6 - EUROPEFigure 17 - Total
- Page 222 and 223:
CHAPTER 6 - EUROPEair quality in th
- Page 224 and 225:
CHAPTER 6 - EUROPEfaculty of MSU, I
- Page 226 and 227:
CHAPTER 6 - EUROPE2007; Andersson e
- Page 228 and 229:
CHAPTER 6 - EUROPETable 3b - Past a
- Page 230 and 231:
CHAPTER 6 - EUROPEexpectancy in NRW
- Page 232 and 233:
CHAPTER 6 - EUROPEtime range of sev
- Page 234 and 235:
CHAPTER 6 - EUROPEFigure 25 - Inhab
- Page 236 and 237:
CHAPTER 6 - EUROPEPiemonte (Turin):
- Page 238 and 239:
CHAPTER 6 - EUROPEFigure 31 - Numbe
- Page 240 and 241:
CHAPTER 6 - EUROPEAs for the develo
- Page 242 and 243:
CHAPTER 6 - EUROPEsub-tropical fron
- Page 244 and 245:
CHAPTER 6 - EUROPEpollutants around
- Page 246 and 247:
CHAPTER 6 - EUROPEaddition to local
- Page 248 and 249:
CHAPTER 6 - EUROPEprecipitation sam
- Page 250 and 251:
CHAPTER 6 - EUROPEstrict legislatio
- Page 252 and 253:
CHAPTER 6 - EUROPECaserini, S., Fra
- Page 254 and 255:
CHAPTER 6 - EUROPEHodzic A., C. H.,
- Page 256 and 257:
CHAPTER 6 - EUROPELondon, T. f. Cle
- Page 258 and 259:
CHAPTER 6 - EUROPETebaldi, G., Angi
- Page 260 and 261:
CHAPTER 7 - OVERVIEW OF INTERNATION
- Page 262 and 263:
CHAPTER 7 - OVERVIEW OF INTERNATION
- Page 264 and 265:
CHAPTER 7 - OVERVIEW OF INTERNATION
- Page 266 and 267:
CHAPTER 7 - OVERVIEW OF INTERNATION
- Page 268 and 269:
CHAPTER 7 - OVERVIEW OF INTERNATION
- Page 270 and 271:
CHAPTER 7 - OVERVIEW OF INTERNATION
- Page 272 and 273:
CHAPTER 7 - OVERVIEW OF INTERNATION
- Page 274 and 275:
CHAPTER 7 - OVERVIEW OF INTERNATION
- Page 276 and 277:
CHAPTER 7 - OVERVIEW OF INTERNATION
- Page 278 and 279:
CHAPTER 7 - OVERVIEW OF INTERNATION
- Page 280 and 281:
7.9 PRIDE-PRDCHAPTER 7 - OVERVIEW O
- Page 282 and 283:
CHAPTER 7 - OVERVIEW OF INTERNATION
- Page 284 and 285:
CHAPTER 7 - OVERVIEW OF INTERNATION
- Page 286 and 287:
CHAPTER 7 - OVERVIEW OF INTERNATION
- Page 288 and 289:
CHAPTER 7 - OVERVIEW OF INTERNATION
- Page 290 and 291:
CHAPTER 7 - OVERVIEW OF INTERNATION
- Page 292 and 293:
CHAPTER 7 - OVERVIEW OF INTERNATION
- Page 294 and 295:
CHAPTER 7 - OVERVIEW OF INTERNATION
- Page 296 and 297:
CHAPTER 8 - KEY ISSUES AND OUTLOOKa
- Page 298 and 299:
CHAPTER 8 - KEY ISSUES AND OUTLOOKi
- Page 300 and 301:
CHAPTER 8 - KEY ISSUES AND OUTLOOKa
- Page 302 and 303:
CHAPTER 8 - KEY ISSUES AND OUTLOOKT
- Page 304 and 305:
CHAPTER 8 - KEY ISSUES AND OUTLOOKs
- Page 306 and 307:
CHAPTER 8 - KEY ISSUES AND OUTLOOKr
- Page 308 and 309:
CHAPTER 8 - KEY ISSUES AND OUTLOOKM
- Page 310 and 311:
LIST OF RECENT GLOBAL ATMOSPHERE WA
- Page 312 and 313:
141. Report of the LAP/COST/WMO Int
- Page 314:
185. Guidelines for the Measurement