CHAPTER 7 – OVERVIEW OF INTERNATIONAL COLLABORATIVE RESEARCH ACTIVITIESWang, W., Ren, L., Zhang, Y., Chen, J., Liu, H., Bao, L., Fan, S., and Tang, D. (2008). AircraftMeasurements of Gaseous Pollutants and Particulate matters Over Pearl River Delta inChina. Atmospheric Environment, 42(25), 6187-6202. doi: 10.1016/j.atmosenv.2008.06.001Wang, X., Zhang, Y., Hu, Y., Zhou, W., Lu, K., Zhong, L., Zeng, L., Shao, M., Hu, M., and Russell, A.G. (2010). Process analysis and sensitivity study of regional ozone formation over the PearlRiver Delta of China during the PRIDE-PRD2004 Campaign using the CMAQ model. Atmos.Chem. Phys., 10(9), 4423-4437. doi: 10.5194/acp-10-4423-2010Wehner, B., Berghof, M., Cheng, Y. F., Achtert, P., Birmili, W., <strong>No</strong>wak, A., Wiedensohler, A.,Garland, R.M., Poschl, U., Hu, M., and Zhu, T. (2009). Mixing state of non-volatile aerosolparticle fractions and comparison with light absorption in the polluted Beijing region. J.Geophys. Res.-Atmos., 114(D00G17), 16. doi: 10.1029/2008JD010923Wendisch, M., Hellmuth, O., Ansmann, A., Heintzenberg, J., Engelmann, R., Althausen, D., Eichlet,Muller, D., Hu, M., Zhang, Y., and Mao, J. (2008). Radiative and dynamic effects ofabsorbing aerosol particles over the Pearl River Delta, China. Atmospheric Environment,42(25), 6405-6416. doi: 10.1016/j.atmosenv.2008.02.033Wiedensohler, A., Cheng, Y. F., <strong>No</strong>wak, A., Wehner, B., Achtert, P., Berghof, M., Birmill, W., Wu,Z.J., Hu, M., Zhu, T., Takegawa, N., Kita, K., Kondo, Y., Lou, S.R., Hofzumahaus, A.,Holland, F., Gunthe, S.S., Rose, D., Su, H., and Pöschl, U. (2009). Rapid aerosol particlegrowth and increase of cloud condensation nucleus activity by secondary aerosol formationand condensation: A case study for regional air pollution in northeastern China. J. Geophys.Res.-Atmos., 114(D00G08), 13. doi: 10.1029/2008JD010884Xiao, R., Takegawa, N., Kondo, Y., Miyazaki, Y., Miyakawa, T., Hu, M., Shao, M., Zeng, L.M.,Hofzumahaus, A., Holland, F., Lu, K., Sugimoto, N., Zhao, Y., and Zhang, Y. H. (2009).Formation of submicron sulfate and organic aerosols in the outflow from the urban region ofthe Pearl River Delta in China. Atmospheric Environment, 43(24), 3754-3763. doi:10.1016/j.atmosenv.2009.04.028Xiao, R., Takegawa, N., Zheng, M., Kondo, Y., Miyazaki, Y., Miyakawa, T., Hu, M., Shao, M., Zeng,L., Gong, Y., Lu, K., Deng, Z., Zhao, Y., and Zhang, Y. H. (2011). Characterization andsource apportionment of submicron aerosol with aerosol mass spectrometer during thePRIDE-PRD 2006 campaign. Atmos. Chem. Phys., 11, 6911-6929, doi:10.5194/acp-11-6911-2011Yuan, Z., Lau, A. K. H., Shao, M., Louie, P. K. K., Liu, S. C., & Zhu, T. (2009). Source analysis ofvolatile organic compounds by positive matrix factorization in urban and rural environmentsin Beijing. J. Geophys. Res.-Atmos., 114(D00G15). doi: 10.1029/2008JD011190Yue, D. L., Hu, M., Zhang, R. Y., Wang, Z. B., Zheng, J., Wu, Z. J., Wiedensohler, A., He, L.Y.,Huang, X.F., and Zhu, T. (2010). The Roles of Sulfuric Acid in New Particle Formation andGrowth in the Mega-city of Beijing. Atmos. Chem. Phys., 10(10), 4953-4960. doi:10.5194/acp-10-4953-2010Zhang, Y. H., Hu, M., Zhong, L. J., Wiedensohler, A., Liu, S. C., Andreae, M. O., Wang, W., and Fan,S. J. (2008). Regional Integrated Experiments on Air Quality over Pearl River Delta 2004(PRIDE-PRD2004): Overview. Atmospheric Environment, 42(25), 6157-6173. doi:10.1016/j.atmosenv.2008.03.025Zhang, Y. H., Su, H., Zhong, L. J., Cheng, Y. F., Zeng, L. M., Wang, X. S., Xiang, Y.R., Wang, J.L.,Gao, D.F., Shao, M., Fan, S.J., and Liu, S. C. (2008). Regional Ozone Pollution andObservation-Based Approach for Analyzing Ozone-Precursor Relationship during thePRIDE-PRD2004 Campaign. Atmospheric Environment, 42(25), 6203-6218. doi:10.1016/j.atmosenv.2008.05.002_______284
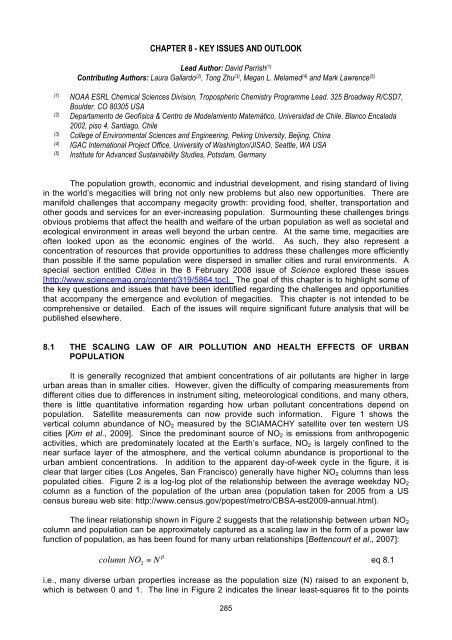
CHAPTER 8 - KEY ISSUES AND OUTLOOKLead Author: David Parrish (1)Contributing Authors: Laura Gallardo (2) , Tong Zhu (3) , Megan L. Melamed (4) and Mark Lawrence (5)(1)NOAA ESRL Chemical Sciences Division, Tropospheric Chemistry Programme Lead. 325 Broadway R/CSD7,Boulder, CO 80305 USA(2)Departamento de Geofísica & Centro de Modelamiento Matemático, Universidad de Chile. Blanco Encalada2002, piso 4, Santiago, Chile(3)College of Environmental Sciences and Engineering, Peking University, Beijing, China(4)<strong>IGAC</strong> International <strong>Project</strong> Office, University of Washington/JISAO, Seattle, WA USA(5)Institute for Advanced Sustainability Studies, Potsdam, GermanyThe population growth, economic and industrial development, and rising standard of livingin the world’s megacities will bring not only new problems but also new opportunities. There aremanifold challenges that accompany megacity growth: providing food, shelter, transportation andother goods and services for an ever-increasing population. Surmounting these challenges bringsobvious problems that affect the health and welfare of the urban population as well as societal andecological environment in areas well beyond the urban centre. At the same time, megacities areoften looked upon as the economic engines of the world. As such, they also represent aconcentration of resources that provide opportunities to address these challenges more efficientlythan possible if the same population were dispersed in smaller cities and rural environments. Aspecial section entitled Cities in the 8 February 2008 issue of Science explored these issues[http://www.sciencemag.org/content/319/5864.toc]. The goal of this chapter is to highlight some ofthe key questions and issues that have been identified regarding the challenges and opportunitiesthat accompany the emergence and evolution of megacities. This chapter is not intended to becomprehensive or detailed. Each of the issues will require significant future analysis that will bepublished elsewhere.8.1 THE SCALING LAW OF AIR POLLUTION AND HEALTH EFFECTS OF URBANPOPULATIONIt is generally recognized that ambient concentrations of air pollutants are higher in largeurban areas than in smaller cities. However, given the difficulty of comparing measurements fromdifferent cities due to differences in instrument siting, meteorological conditions, and many others,there is little quantitative information regarding how urban pollutant concentrations depend onpopulation. Satellite measurements can now provide such information. Figure 1 shows thevertical column abundance of NO 2 measured by the SCIAMACHY satellite over ten western UScities [Kim et al., 2009]. Since the predominant source of NO 2 is emissions from anthropogenicactivities, which are predominately located at the Earth’s surface, NO 2 is largely confined to thenear surface layer of the atmosphere, and the vertical column abundance is proportional to theurban ambient concentrations. In addition to the apparent day-of-week cycle in the figure, it isclear that larger cities (Los Angeles, San Francisco) generally have higher NO 2 columns than lesspopulated cities. Figure 2 is a log-log plot of the relationship between the average weekday NO 2column as a function of the population of the urban area (population taken for 2005 from a UScensus bureau web site: http://www.census.gov/popest/metro/CBSA-est2009-annual.html).The linear relationship shown in Figure 2 suggests that the relationship between urban NO 2column and population can be approximately captured as a scaling law in the form of a power lawfunction of population, as has been found for many urban relationships [Bettencourt et al., 2007]:column NO 2= N " eq 8.1i.e., many diverse urban properties increase as the population size (N) raised to an exponent b,which is between 0 and 1. The line in Figure 2 indicates the linear least-squares fit to the points!285
- Page 2:
© World Meteorological Organizatio
- Page 8 and 9:
The second lead authors meeting was
- Page 12 and 13:
CHAPTER 1 - INTRODUCTIONatmospheric
- Page 14 and 15:
CHAPTER 1 - INTRODUCTIONThe impact
- Page 16 and 17:
CHAPTER 1 - INTRODUCTIONEquations 1
- Page 18 and 19:
CHAPTER 1 - INTRODUCTIONThere is a
- Page 20 and 21:
CHAPTER 1 - INTRODUCTIONFigure 8 -
- Page 22 and 23:
CHAPTER 1 - INTRODUCTIONLow-income
- Page 24 and 25:
CHAPTER 1 - INTRODUCTION1.5 SCIENTI
- Page 26 and 27:
CHAPTER 1 - INTRODUCTIONFigure 12 -
- Page 28 and 29:
CHAPTER 1 - INTRODUCTIONthese aeros
- Page 30 and 31:
CHAPTER 1 - INTRODUCTIONFigure 16:
- Page 32 and 33:
CHAPTER 1 - INTRODUCTIONFigure 18 -
- Page 34 and 35:
CHAPTER 1 - INTRODUCTIONReferencesA
- Page 36 and 37:
CHAPTER 1 - INTRODUCTIONLeibensperg
- Page 38 and 39:
CHAPTER 2 - AFRICACoordinating auth
- Page 40 and 41:
CHAPTER 2 - AFRICAFigure 3 displays
- Page 42 and 43:
CHAPTER 2 - AFRICAabout 2,000 mm pe
- Page 44 and 45:
CHAPTER 2 - AFRICAFigure 5 - NO2 me
- Page 46 and 47:
CHAPTER 2 - AFRICAIn West-African c
- Page 48 and 49:
CHAPTER 2 - AFRICAratios in Bamako
- Page 50 and 51:
CHAPTER 2 - AFRICAAs shown in Figur
- Page 52 and 53:
CHAPTER 2 - AFRICAof the city of Jo
- Page 54 and 55:
CHAPTER 2 - AFRICAlow smoke coal wa
- Page 56 and 57:
CHAPTER 2 - AFRICAcompleted, their
- Page 58 and 59:
CHAPTER 2 - AFRICAepidemiological d
- Page 60 and 61:
CHAPTER 2 - AFRICAPopulationGrowthR
- Page 62 and 63:
CHAPTER 2 - AFRICAcycle with levels
- Page 64 and 65:
CHAPTER 2 - AFRICAcomparable to tho
- Page 66 and 67:
CHAPTER 2 - AFRICAFavez, O., Sciare
- Page 68 and 69:
CHAPTER 2 - AFRICASeagrave, J., McD
- Page 70 and 71:
CHAPTER 3 - ASIAThe bottom-up and t
- Page 72 and 73:
CHAPTER 3 - ASIAFigure 2 - (a) CO e
- Page 74 and 75:
CHAPTER 3 - ASIAand Kim Oanh, 2002]
- Page 76 and 77:
CHAPTER 3 - ASIAFigure 4 - Annual a
- Page 78 and 79:
CHAPTER 3 - ASIAmaintenance program
- Page 80 and 81:
CHAPTER 3 - ASIAnearly half of the
- Page 82 and 83:
CHAPTER 3 - ASIARelationships of th
- Page 84 and 85:
CHAPTER 3 - ASIAFigure 12 - Graphic
- Page 86 and 87:
CHAPTER 3 - ASIAAnother significant
- Page 88 and 89:
CHAPTER 3 - ASIAand international),
- Page 90 and 91:
CHAPTER 3 - ASIAFigure 17 - (a) Var
- Page 92 and 93:
CHAPTER 3 - ASIAEmissions inventory
- Page 94 and 95:
CHAPTER 3 - ASIAAir Quality Index r
- Page 96 and 97:
CHAPTER 3 - ASIA• Strict restrict
- Page 98 and 99:
CHAPTER 3 - ASIAis due the ban of l
- Page 100 and 101:
CHAPTER 3 - ASIAAvailability of air
- Page 102 and 103:
CHAPTER 3 - ASIAFigure 26 - Box plo
- Page 104 and 105:
CHAPTER 3 - ASIAResearch projects o
- Page 106 and 107:
CHAPTER 3 - ASIAmonitoring stations
- Page 108 and 109:
CHAPTER 3 - ASIApreliminary stage.
- Page 110 and 111:
CHAPTER 3 - ASIATable 8 - National
- Page 112 and 113:
CHAPTER 3 - ASIAControl strategiesA
- Page 114 and 115:
CHAPTER 3 - ASIAMetro Manila Air Qu
- Page 116 and 117:
CHAPTER 3 - ASIAmoves inland and O
- Page 118 and 119:
CHAPTER 3 - ASIAHong Kong and Macau
- Page 120 and 121:
CHAPTER 3 - ASIAFigure 39 - A 52-ye
- Page 122 and 123:
CHAPTER 3 - ASIAClimatic change iss
- Page 124 and 125:
CHAPTER 3 - ASIAEmission sources of
- Page 126 and 127:
CHAPTER 3 - ASIAIn the case of PM 1
- Page 128 and 129:
CHAPTER 3 - ASIAdue to yellow sand
- Page 130 and 131:
CHAPTER 3 - ASIAEmission inventorie
- Page 132 and 133:
CHAPTER 3 - ASIAatmosphere, which i
- Page 134 and 135:
CHAPTER 3 - ASIAEmissions of NO X f
- Page 136 and 137:
CHAPTER 3 - ASIAFigure 58 - Annuall
- Page 138 and 139:
CHAPTER 3 - ASIAThe predominance of
- Page 140 and 141:
CHAPTER 3 - ASIAthe negative health
- Page 142 and 143:
CHAPTER 3 - ASIAAsrari, E., Ghole,
- Page 144 and 145:
CHAPTER 3 - ASIAGuo H, Fine AJ, So
- Page 146 and 147:
CHAPTER 3 - ASIALi L., Chen C.H., H
- Page 148 and 149:
CHAPTER 3 - ASIAPollution Control D
- Page 150 and 151:
CHAPTER 3 - ASIAYu JZ, Tung JWT, Wu
- Page 152 and 153:
CHAPTER 4 - SOUTH AMERICAand human
- Page 154 and 155:
CHAPTER 4 - SOUTH AMERICA4.1.2 Emis
- Page 156 and 157:
CHAPTER 4 - SOUTH AMERICATable 4 -
- Page 158 and 159:
CHAPTER 4 - SOUTH AMERICAemissions
- Page 160 and 161:
CHAPTER 4 - SOUTH AMERICAthird moun
- Page 162 and 163:
4.3 BUENOS AIRES, ARGENTINACHAPTER
- Page 164 and 165:
CHAPTER 4 - SOUTH AMERICAless than
- Page 166 and 167:
CHAPTER 4 - SOUTH AMERICApart of Sa
- Page 168 and 169:
CHAPTER 4 - SOUTH AMERICAThe Nation
- Page 170 and 171:
CHAPTER 4 - SOUTH AMERICA4.7 SÃO P
- Page 172 and 173:
CHAPTER 4 - SOUTH AMERICAhydrocarbo
- Page 174 and 175:
CHAPTER 4 - SOUTH AMERICAthat such
- Page 176 and 177:
CHAPTER 4 - SOUTH AMERICACorvalán,
- Page 178 and 179:
CHAPTER 4 - SOUTH AMERICALongo, K.
- Page 180 and 181:
CHAPTER 4 - SOUTH AMERICARomero Lan
- Page 182 and 183:
CHAPTER 5 - NORTH AMERICACoordinati
- Page 184 and 185:
CHAPTER 5 - NORTH AMERICAstories fo
- Page 186 and 187:
CHAPTER 5 - NORTH AMERICAthat impro
- Page 188 and 189:
CHAPTER 5 - NORTH AMERICA5.2 THE US
- Page 190 and 191:
CHAPTER 5 - NORTH AMERICAcontributi
- Page 192 and 193:
CHAPTER 5 - NORTH AMERICAseason fro
- Page 194 and 195:
CHAPTER 5 - NORTH AMERICAtoluene, a
- Page 196 and 197:
CHAPTER 5 - NORTH AMERICAand small
- Page 198 and 199:
CHAPTER 5 - NORTH AMERICABlumenthal
- Page 200 and 201:
CHAPTER 5 - NORTH AMERICALei, W., Z
- Page 202 and 203:
CHAPTER 5 - NORTH AMERICAVelasco, E
- Page 204 and 205:
CHAPTER 6 - EUROPEFigure 1 shows a
- Page 206 and 207:
CHAPTER 6 - EUROPE6.1.3 Pollution l
- Page 208 and 209:
CHAPTER 6 - EUROPEFigure 4 - [Carsl
- Page 210 and 211:
CHAPTER 6 - EUROPEFigure 7 - Greate
- Page 212 and 213:
CHAPTER 6 - EUROPEFigure 9 - Partit
- Page 214 and 215:
CHAPTER 6 - EUROPEFrom a regulatory
- Page 216 and 217:
CHAPTER 6 - EUROPEB) Particulate ma
- Page 218 and 219:
CHAPTER 6 - EUROPE• During the wi
- Page 220 and 221:
CHAPTER 6 - EUROPEFigure 17 - Total
- Page 222 and 223:
CHAPTER 6 - EUROPEair quality in th
- Page 224 and 225:
CHAPTER 6 - EUROPEfaculty of MSU, I
- Page 226 and 227:
CHAPTER 6 - EUROPE2007; Andersson e
- Page 228 and 229:
CHAPTER 6 - EUROPETable 3b - Past a
- Page 230 and 231:
CHAPTER 6 - EUROPEexpectancy in NRW
- Page 232 and 233:
CHAPTER 6 - EUROPEtime range of sev
- Page 234 and 235:
CHAPTER 6 - EUROPEFigure 25 - Inhab
- Page 236 and 237:
CHAPTER 6 - EUROPEPiemonte (Turin):
- Page 238 and 239:
CHAPTER 6 - EUROPEFigure 31 - Numbe
- Page 240 and 241:
CHAPTER 6 - EUROPEAs for the develo
- Page 242 and 243:
CHAPTER 6 - EUROPEsub-tropical fron
- Page 244 and 245: CHAPTER 6 - EUROPEpollutants around
- Page 246 and 247: CHAPTER 6 - EUROPEaddition to local
- Page 248 and 249: CHAPTER 6 - EUROPEprecipitation sam
- Page 250 and 251: CHAPTER 6 - EUROPEstrict legislatio
- Page 252 and 253: CHAPTER 6 - EUROPECaserini, S., Fra
- Page 254 and 255: CHAPTER 6 - EUROPEHodzic A., C. H.,
- Page 256 and 257: CHAPTER 6 - EUROPELondon, T. f. Cle
- Page 258 and 259: CHAPTER 6 - EUROPETebaldi, G., Angi
- Page 260 and 261: CHAPTER 7 - OVERVIEW OF INTERNATION
- Page 262 and 263: CHAPTER 7 - OVERVIEW OF INTERNATION
- Page 264 and 265: CHAPTER 7 - OVERVIEW OF INTERNATION
- Page 266 and 267: CHAPTER 7 - OVERVIEW OF INTERNATION
- Page 268 and 269: CHAPTER 7 - OVERVIEW OF INTERNATION
- Page 270 and 271: CHAPTER 7 - OVERVIEW OF INTERNATION
- Page 272 and 273: CHAPTER 7 - OVERVIEW OF INTERNATION
- Page 274 and 275: CHAPTER 7 - OVERVIEW OF INTERNATION
- Page 276 and 277: CHAPTER 7 - OVERVIEW OF INTERNATION
- Page 278 and 279: CHAPTER 7 - OVERVIEW OF INTERNATION
- Page 280 and 281: 7.9 PRIDE-PRDCHAPTER 7 - OVERVIEW O
- Page 282 and 283: CHAPTER 7 - OVERVIEW OF INTERNATION
- Page 284 and 285: CHAPTER 7 - OVERVIEW OF INTERNATION
- Page 286 and 287: CHAPTER 7 - OVERVIEW OF INTERNATION
- Page 288 and 289: CHAPTER 7 - OVERVIEW OF INTERNATION
- Page 290 and 291: CHAPTER 7 - OVERVIEW OF INTERNATION
- Page 292 and 293: CHAPTER 7 - OVERVIEW OF INTERNATION
- Page 296 and 297: CHAPTER 8 - KEY ISSUES AND OUTLOOKa
- Page 298 and 299: CHAPTER 8 - KEY ISSUES AND OUTLOOKi
- Page 300 and 301: CHAPTER 8 - KEY ISSUES AND OUTLOOKa
- Page 302 and 303: CHAPTER 8 - KEY ISSUES AND OUTLOOKT
- Page 304 and 305: CHAPTER 8 - KEY ISSUES AND OUTLOOKs
- Page 306 and 307: CHAPTER 8 - KEY ISSUES AND OUTLOOKr
- Page 308 and 309: CHAPTER 8 - KEY ISSUES AND OUTLOOKM
- Page 310 and 311: LIST OF RECENT GLOBAL ATMOSPHERE WA
- Page 312 and 313: 141. Report of the LAP/COST/WMO Int
- Page 314: 185. Guidelines for the Measurement