- Page 2: © World Meteorological Organizatio
- Page 8 and 9: The second lead authors meeting was
- Page 12 and 13: CHAPTER 1 - INTRODUCTIONatmospheric
- Page 14 and 15: CHAPTER 1 - INTRODUCTIONThe impact
- Page 16 and 17: CHAPTER 1 - INTRODUCTIONEquations 1
- Page 18 and 19: CHAPTER 1 - INTRODUCTIONThere is a
- Page 20 and 21: CHAPTER 1 - INTRODUCTIONFigure 8 -
- Page 22 and 23: CHAPTER 1 - INTRODUCTIONLow-income
- Page 24 and 25: CHAPTER 1 - INTRODUCTION1.5 SCIENTI
- Page 26 and 27: CHAPTER 1 - INTRODUCTIONFigure 12 -
- Page 28 and 29: CHAPTER 1 - INTRODUCTIONthese aeros
- Page 30 and 31: CHAPTER 1 - INTRODUCTIONFigure 16:
- Page 32 and 33: CHAPTER 1 - INTRODUCTIONFigure 18 -
- Page 34 and 35: CHAPTER 1 - INTRODUCTIONReferencesA
- Page 36 and 37: CHAPTER 1 - INTRODUCTIONLeibensperg
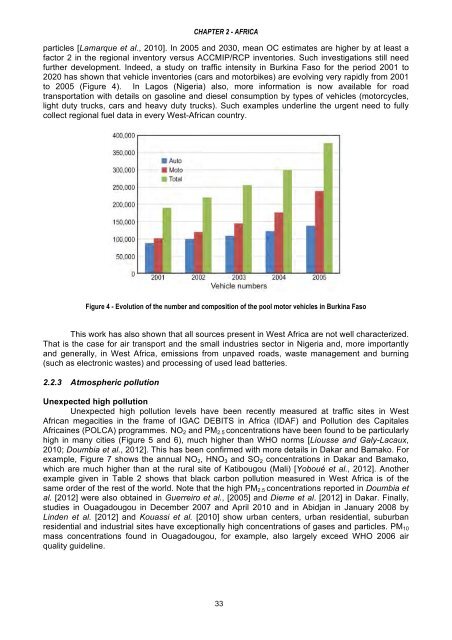
- Page 38 and 39: CHAPTER 2 - AFRICACoordinating auth
- Page 40 and 41: CHAPTER 2 - AFRICAFigure 3 displays
- Page 44 and 45: CHAPTER 2 - AFRICAFigure 5 - NO2 me
- Page 46 and 47: CHAPTER 2 - AFRICAIn West-African c
- Page 48 and 49: CHAPTER 2 - AFRICAratios in Bamako
- Page 50 and 51: CHAPTER 2 - AFRICAAs shown in Figur
- Page 52 and 53: CHAPTER 2 - AFRICAof the city of Jo
- Page 54 and 55: CHAPTER 2 - AFRICAlow smoke coal wa
- Page 56 and 57: CHAPTER 2 - AFRICAcompleted, their
- Page 58 and 59: CHAPTER 2 - AFRICAepidemiological d
- Page 60 and 61: CHAPTER 2 - AFRICAPopulationGrowthR
- Page 62 and 63: CHAPTER 2 - AFRICAcycle with levels
- Page 64 and 65: CHAPTER 2 - AFRICAcomparable to tho
- Page 66 and 67: CHAPTER 2 - AFRICAFavez, O., Sciare
- Page 68 and 69: CHAPTER 2 - AFRICASeagrave, J., McD
- Page 70 and 71: CHAPTER 3 - ASIAThe bottom-up and t
- Page 72 and 73: CHAPTER 3 - ASIAFigure 2 - (a) CO e
- Page 74 and 75: CHAPTER 3 - ASIAand Kim Oanh, 2002]
- Page 76 and 77: CHAPTER 3 - ASIAFigure 4 - Annual a
- Page 78 and 79: CHAPTER 3 - ASIAmaintenance program
- Page 80 and 81: CHAPTER 3 - ASIAnearly half of the
- Page 82 and 83: CHAPTER 3 - ASIARelationships of th
- Page 84 and 85: CHAPTER 3 - ASIAFigure 12 - Graphic
- Page 86 and 87: CHAPTER 3 - ASIAAnother significant
- Page 88 and 89: CHAPTER 3 - ASIAand international),
- Page 90 and 91: CHAPTER 3 - ASIAFigure 17 - (a) Var
- Page 92 and 93:
CHAPTER 3 - ASIAEmissions inventory
- Page 94 and 95:
CHAPTER 3 - ASIAAir Quality Index r
- Page 96 and 97:
CHAPTER 3 - ASIA• Strict restrict
- Page 98 and 99:
CHAPTER 3 - ASIAis due the ban of l
- Page 100 and 101:
CHAPTER 3 - ASIAAvailability of air
- Page 102 and 103:
CHAPTER 3 - ASIAFigure 26 - Box plo
- Page 104 and 105:
CHAPTER 3 - ASIAResearch projects o
- Page 106 and 107:
CHAPTER 3 - ASIAmonitoring stations
- Page 108 and 109:
CHAPTER 3 - ASIApreliminary stage.
- Page 110 and 111:
CHAPTER 3 - ASIATable 8 - National
- Page 112 and 113:
CHAPTER 3 - ASIAControl strategiesA
- Page 114 and 115:
CHAPTER 3 - ASIAMetro Manila Air Qu
- Page 116 and 117:
CHAPTER 3 - ASIAmoves inland and O
- Page 118 and 119:
CHAPTER 3 - ASIAHong Kong and Macau
- Page 120 and 121:
CHAPTER 3 - ASIAFigure 39 - A 52-ye
- Page 122 and 123:
CHAPTER 3 - ASIAClimatic change iss
- Page 124 and 125:
CHAPTER 3 - ASIAEmission sources of
- Page 126 and 127:
CHAPTER 3 - ASIAIn the case of PM 1
- Page 128 and 129:
CHAPTER 3 - ASIAdue to yellow sand
- Page 130 and 131:
CHAPTER 3 - ASIAEmission inventorie
- Page 132 and 133:
CHAPTER 3 - ASIAatmosphere, which i
- Page 134 and 135:
CHAPTER 3 - ASIAEmissions of NO X f
- Page 136 and 137:
CHAPTER 3 - ASIAFigure 58 - Annuall
- Page 138 and 139:
CHAPTER 3 - ASIAThe predominance of
- Page 140 and 141:
CHAPTER 3 - ASIAthe negative health
- Page 142 and 143:
CHAPTER 3 - ASIAAsrari, E., Ghole,
- Page 144 and 145:
CHAPTER 3 - ASIAGuo H, Fine AJ, So
- Page 146 and 147:
CHAPTER 3 - ASIALi L., Chen C.H., H
- Page 148 and 149:
CHAPTER 3 - ASIAPollution Control D
- Page 150 and 151:
CHAPTER 3 - ASIAYu JZ, Tung JWT, Wu
- Page 152 and 153:
CHAPTER 4 - SOUTH AMERICAand human
- Page 154 and 155:
CHAPTER 4 - SOUTH AMERICA4.1.2 Emis
- Page 156 and 157:
CHAPTER 4 - SOUTH AMERICATable 4 -
- Page 158 and 159:
CHAPTER 4 - SOUTH AMERICAemissions
- Page 160 and 161:
CHAPTER 4 - SOUTH AMERICAthird moun
- Page 162 and 163:
4.3 BUENOS AIRES, ARGENTINACHAPTER
- Page 164 and 165:
CHAPTER 4 - SOUTH AMERICAless than
- Page 166 and 167:
CHAPTER 4 - SOUTH AMERICApart of Sa
- Page 168 and 169:
CHAPTER 4 - SOUTH AMERICAThe Nation
- Page 170 and 171:
CHAPTER 4 - SOUTH AMERICA4.7 SÃO P
- Page 172 and 173:
CHAPTER 4 - SOUTH AMERICAhydrocarbo
- Page 174 and 175:
CHAPTER 4 - SOUTH AMERICAthat such
- Page 176 and 177:
CHAPTER 4 - SOUTH AMERICACorvalán,
- Page 178 and 179:
CHAPTER 4 - SOUTH AMERICALongo, K.
- Page 180 and 181:
CHAPTER 4 - SOUTH AMERICARomero Lan
- Page 182 and 183:
CHAPTER 5 - NORTH AMERICACoordinati
- Page 184 and 185:
CHAPTER 5 - NORTH AMERICAstories fo
- Page 186 and 187:
CHAPTER 5 - NORTH AMERICAthat impro
- Page 188 and 189:
CHAPTER 5 - NORTH AMERICA5.2 THE US
- Page 190 and 191:
CHAPTER 5 - NORTH AMERICAcontributi
- Page 192 and 193:
CHAPTER 5 - NORTH AMERICAseason fro
- Page 194 and 195:
CHAPTER 5 - NORTH AMERICAtoluene, a
- Page 196 and 197:
CHAPTER 5 - NORTH AMERICAand small
- Page 198 and 199:
CHAPTER 5 - NORTH AMERICABlumenthal
- Page 200 and 201:
CHAPTER 5 - NORTH AMERICALei, W., Z
- Page 202 and 203:
CHAPTER 5 - NORTH AMERICAVelasco, E
- Page 204 and 205:
CHAPTER 6 - EUROPEFigure 1 shows a
- Page 206 and 207:
CHAPTER 6 - EUROPE6.1.3 Pollution l
- Page 208 and 209:
CHAPTER 6 - EUROPEFigure 4 - [Carsl
- Page 210 and 211:
CHAPTER 6 - EUROPEFigure 7 - Greate
- Page 212 and 213:
CHAPTER 6 - EUROPEFigure 9 - Partit
- Page 214 and 215:
CHAPTER 6 - EUROPEFrom a regulatory
- Page 216 and 217:
CHAPTER 6 - EUROPEB) Particulate ma
- Page 218 and 219:
CHAPTER 6 - EUROPE• During the wi
- Page 220 and 221:
CHAPTER 6 - EUROPEFigure 17 - Total
- Page 222 and 223:
CHAPTER 6 - EUROPEair quality in th
- Page 224 and 225:
CHAPTER 6 - EUROPEfaculty of MSU, I
- Page 226 and 227:
CHAPTER 6 - EUROPE2007; Andersson e
- Page 228 and 229:
CHAPTER 6 - EUROPETable 3b - Past a
- Page 230 and 231:
CHAPTER 6 - EUROPEexpectancy in NRW
- Page 232 and 233:
CHAPTER 6 - EUROPEtime range of sev
- Page 234 and 235:
CHAPTER 6 - EUROPEFigure 25 - Inhab
- Page 236 and 237:
CHAPTER 6 - EUROPEPiemonte (Turin):
- Page 238 and 239:
CHAPTER 6 - EUROPEFigure 31 - Numbe
- Page 240 and 241:
CHAPTER 6 - EUROPEAs for the develo
- Page 242 and 243:
CHAPTER 6 - EUROPEsub-tropical fron
- Page 244 and 245:
CHAPTER 6 - EUROPEpollutants around
- Page 246 and 247:
CHAPTER 6 - EUROPEaddition to local
- Page 248 and 249:
CHAPTER 6 - EUROPEprecipitation sam
- Page 250 and 251:
CHAPTER 6 - EUROPEstrict legislatio
- Page 252 and 253:
CHAPTER 6 - EUROPECaserini, S., Fra
- Page 254 and 255:
CHAPTER 6 - EUROPEHodzic A., C. H.,
- Page 256 and 257:
CHAPTER 6 - EUROPELondon, T. f. Cle
- Page 258 and 259:
CHAPTER 6 - EUROPETebaldi, G., Angi
- Page 260 and 261:
CHAPTER 7 - OVERVIEW OF INTERNATION
- Page 262 and 263:
CHAPTER 7 - OVERVIEW OF INTERNATION
- Page 264 and 265:
CHAPTER 7 - OVERVIEW OF INTERNATION
- Page 266 and 267:
CHAPTER 7 - OVERVIEW OF INTERNATION
- Page 268 and 269:
CHAPTER 7 - OVERVIEW OF INTERNATION
- Page 270 and 271:
CHAPTER 7 - OVERVIEW OF INTERNATION
- Page 272 and 273:
CHAPTER 7 - OVERVIEW OF INTERNATION
- Page 274 and 275:
CHAPTER 7 - OVERVIEW OF INTERNATION
- Page 276 and 277:
CHAPTER 7 - OVERVIEW OF INTERNATION
- Page 278 and 279:
CHAPTER 7 - OVERVIEW OF INTERNATION
- Page 280 and 281:
7.9 PRIDE-PRDCHAPTER 7 - OVERVIEW O
- Page 282 and 283:
CHAPTER 7 - OVERVIEW OF INTERNATION
- Page 284 and 285:
CHAPTER 7 - OVERVIEW OF INTERNATION
- Page 286 and 287:
CHAPTER 7 - OVERVIEW OF INTERNATION
- Page 288 and 289:
CHAPTER 7 - OVERVIEW OF INTERNATION
- Page 290 and 291:
CHAPTER 7 - OVERVIEW OF INTERNATION
- Page 292 and 293:
CHAPTER 7 - OVERVIEW OF INTERNATION
- Page 294 and 295:
CHAPTER 7 - OVERVIEW OF INTERNATION
- Page 296 and 297:
CHAPTER 8 - KEY ISSUES AND OUTLOOKa
- Page 298 and 299:
CHAPTER 8 - KEY ISSUES AND OUTLOOKi
- Page 300 and 301:
CHAPTER 8 - KEY ISSUES AND OUTLOOKa
- Page 302 and 303:
CHAPTER 8 - KEY ISSUES AND OUTLOOKT
- Page 304 and 305:
CHAPTER 8 - KEY ISSUES AND OUTLOOKs
- Page 306 and 307:
CHAPTER 8 - KEY ISSUES AND OUTLOOKr
- Page 308 and 309:
CHAPTER 8 - KEY ISSUES AND OUTLOOKM
- Page 310 and 311:
LIST OF RECENT GLOBAL ATMOSPHERE WA
- Page 312 and 313:
141. Report of the LAP/COST/WMO Int
- Page 314:
185. Guidelines for the Measurement